Something unusual just happened with one mid-cap token, and traders cannot stop talking about it. Velvet Price Prediction Shows A Coin Suddenly Waking Up Velvet price prediction conversations
Something unusual just happened with one mid-cap token, and traders cannot stop talking about it.
Velvet Price Prediction Shows A Coin Suddenly Waking Up
Velvet price prediction conversations are heating up fast after the token ripped higher in a single session. $VELVET is trading near $0.8338 right now, and the move has caught a lot of people off guard.
Price did not just creep up slowly. It broke out of a pattern that had been forming for almost three weeks straight.
Traders who were watching quietly are suddenly asking the same question. Is this the start of something bigger or just another fast pump that fades?
What Exactly Is Velvet And Why People Care
Velvet is the native token of a DAO built around portfolio management and AI-driven trading tools on-chain. It runs on its own ecosystem with a staking layer called VELVET that rewards long-term holders.
The project launched its token relatively recently and has been building utility around fee sharing and treasury management products since.
Velvet Coin Overview: What The Numbers Show Right NowFieldDetailsCoin NameVelvetTicker SymbolVELVETBlockchainBNB Chain (BSC) and BaseToday High$0.8046Today Low$0.4828RSI Level81.40 (4H Chart)Token TypeUtility and GovernanceMarket Cap$343.5M24H Trading Volume$26.65MCirculating Supply420.8M VELVET24H Change+67.9%
Source: Data by CoinMarketCap
Why This Coin Matters Beyond The Hype
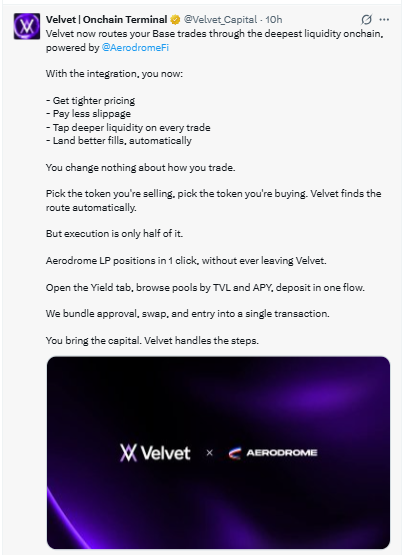
Velvet is not just a random chart spike. The team recently rolled out a routing integration with Aerodrome, letting users get deeper liquidity on trades and access yield pools without leaving the platform.
Basically the protocol is trying to bundle swapping and earning into one click. That kind of real product activity is what separates this from pure speculation.
There's also a backer list that includes names like Binance Labs and Cointelegraph Ventures, which adds some credibility beyond just community noise.
Velvet Onchain Terminal Update Sparks Fresh Attention
Posted on X, the Velvet Onchain Terminal account shared a fresh update right as the breakout was forming.
The post explained that Velvet now routes base trades through Aerodrome for tighter pricing and deeper liquidity while also letting users open LP positions in one click without leaving the platform.
Source: posted on X, Velvet
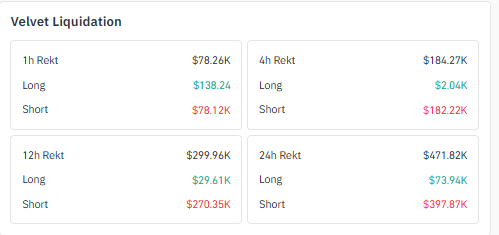
Velvet Liquidation Data Tells Its Own Story
In the last 24 hours alone, short sellers got hit hard. Short-side liquidations reached $397.87K compared to just $73.94K on the long side.
Source: Data by CoinGlass
That's a heavy one-sided wipeout. Turns out a lot of traders were betting against this move and got squeezed out fast.
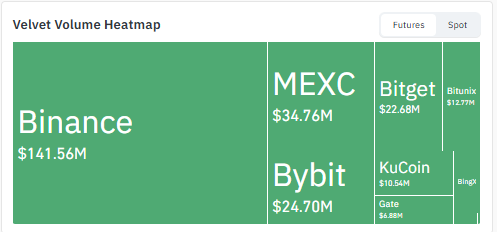
Velvet Volume Heatmap Shows Where The Real Action Is
Most of the trading activity is sitting on Binance, which alone accounts for $141.56M in volume right now.
MEXC and Bybit follow behind with $34.76M and $24.70M, while Bitget, KuCoin, and smaller venues like Gate and Bitunix are splitting the rest.
Basically, the bulk of liquidity is concentrated on one or two exchanges, which means price can move sharply when big orders hit.
Source: Volume Heatmap Data by CoinGlass
Technical Price Analysis Behind The $VELVET Surge
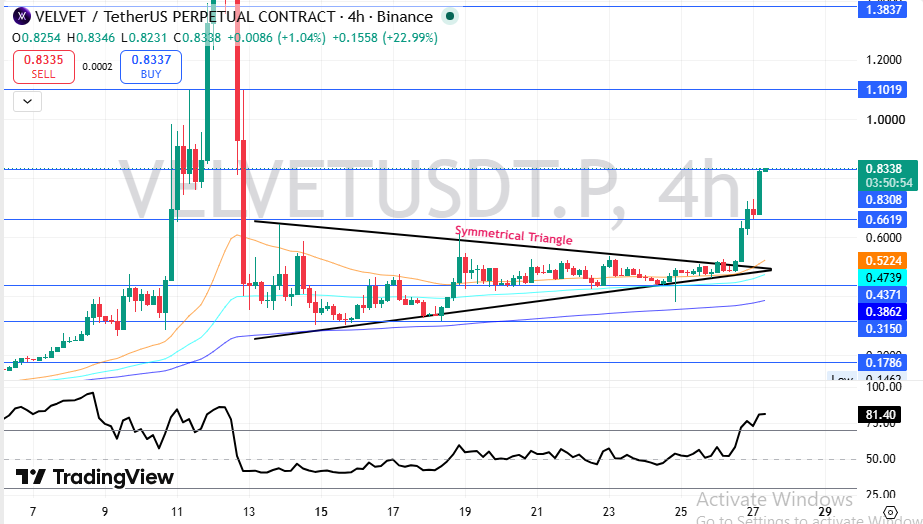
Here's the thing: this breakout did not happen on light volume. $VELVET smashed out of a symmetrical triangle that had been tightening for weeks, and volume exploded right at the breakout candle.
Source: Charting by TradingView
The price is now trading above all three major EMAs. The 50 EMA sits at $0.5224, the 100 EMA at $0.4739, and the 200 EMA way below at $0.3862.
When we pulled up the RSI, the first thing that stood out was a reading of 81.40. That's deep into overbought territory on the 4-hour chart.
But overbought does not always mean reversal. In strong trending breakouts, RSI can stay hot for days before cooling off.
Immediate resistance sits at $1.1019, and beyond that $1.3837 comes into play.
On the downside, $0.6619 is the first cushion if momentum slows.
Short-Term Price Outlook For The Coming Days
The next few days will likely decide whether this breakout has real legs or needs to cool down first.
TimeframeBearish TargetBase TargetBullish TargetKey Trigger24 Hours$0.6619$0.8338$1.1019RSI cools without losing the breakout zone3-7 Days$0.5224$0.9200$1.3837Volume holds above breakout day levels2-4 Weeks$0.4371$1.0000$1.5000Broader market stays risk on
Watch the $0.6619 zone closely; losing it would hurt the bullish case fast.
Long-Term Price Outlook Into 2026 And Beyond
Zooming out, thelong-term Velvet price prediction path depends heavily on whether the Aerodrome integration actually drives sticky volume.
TimeframeBearish TargetBase TargetBullish TargetCatalyst Needed3 Months$0.3862$0.9500$1.3837Sustained DEX volume growth on Base6 Months$0.3150$1.1000$1.6500New vault products gaining real usersEnd of Year$0.2800$1.2500$1.8500Major exchange listing expansion2027 Outlook$0.1786$1.4000$2.2000DAO treasury deploys capital effectively
The long-term case leans cautiously optimistic, but it's far from guaranteed; this needs follow-through.
Three Price Scenarios Traders Should Prepare For
Worst Case: Momentum fails and RSI divergence shows up on the next push. Price slips back below $0.6619 and traps late buyers.
Base Case: Price consolidates between $0.66 and $1.10 for one to two weeks. Volume gradually normalizes while the trend stays intact.
Best Case: Volume stays elevated and shorts keep getting squeezed in what looks like acontinued short squeeze. Price pushes through $1.1019 toward $1.3837 within weeks.
ScenarioPrice RangeWhat Triggers ItWorst Case$0.38 - $0.55Breakout fails and volume dries upBase Case$0.66 - $1.10Healthy consolidation after the spikeBest Case$1.10 - $1.38Continued short squeeze and fresh demandKey Price Levels Every $VELVET Trader Should Watch
Resistance zone: $1.1019; a clean break here opens the door toward $1.3837.
Support zone: $0.6619. This is the first real test if momentum fades.
Invalidation zone: below $0.4371, a daily close under this would break the bullish structure completely.
Fundamental Strength Behind The Velvet Ecosystem
Revenue from the protocol gets split fairly, with half going to $VELVET stakers and half to the DAO treasury. That structure rewards long-term participation over quick flips.
And the team holds a 4-year vesting schedule, which at least shows some commitment to not dumping early.
How VELVET Compares Against Similar DAO Tokens
Compared to otherDAO tokens in the same portfolio management category, VELVET's market cap near $343.5M still leaves room to grow if adoption keeps climbing.
Its liquidity to market cap ratio of 2.57% is decent but not extreme, meaning the move was driven by real demand rather than thin order books alone.
Analyst View And Final Thoughts On The VELVET Breakout
The setup looks more bullish than most are giving it credit for right now. Breaking a multi-week triangle on heavy volume is not a small thing.
RSI at 81 is stretched, no doubt. But strong trends often ignore overbought signals longer than expected.
A weekly close holding above $0.6619 would tell us this is more than a one-day pump. That's the level that matters most going forward.
One thing outside the chart is worth tracking: whether the aerodrome integration actually pulls in sustained trading volume over the next month.
Watch $1.1019 above and $0.6619 below; those two levels frame the entire next chapter for this coin.
This is one of those setups where the chart and the news lined up at the same time, and that combination rarely happens by accident.
Disclaimer
This article is for educational purposes only and does not constitute financial advice. Crypto markets are volatile. Consult your investment advisor before making any investment decision.