VELVET spent the first half of August climbing inside a tight ascending channel, gaining momentum with every passing session. Then, just as the rally looked unstoppable, the token slipped out
VELVET spent the first half of August climbing inside a tight ascending channel, gaining momentum with every passing session.
Then, just as the rally looked unstoppable, the token slipped out of that structure and dropped straight into a support zone few traders expected. Buyers showed up anyway.
Now, with the price consolidating below its broken trendline and RSI hovering near the midpoint, thisVELVET price prediction looks at whether the coin has enough strength left to reclaim the channel or whether a deeper pullback is still on the table.
Why Is VELVET's Price Moving Today?
As per CoinMarketCap, VELVET is trading around $0.6693, up 21.61% in the past 24 hours, extending a stretch of strong short-term momentum.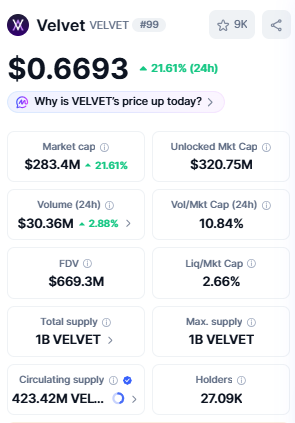
The rally has pushed market cap to $283.4M, moving roughly in line with the price gain, while 24-hour trading volume stands at $30.36M.
That puts the volume/market cap ratio at 10.84%, a level that suggests the move is backed by real trading activity rather than thin liquidity.
The circulating supply currently sits at 423.42M VELVET out of a fixed 1 billion total supply, and the holder count has climbed to 27.09K addresses.
What Are Futures Traders Signalling?
As per the CoinGlass, open interest stood at $53.13M as of the latest reading, having climbed sharply from around $20M in early August to a peak near $60M by mid-month before easing slightly and turning back up alongside the recent price strength.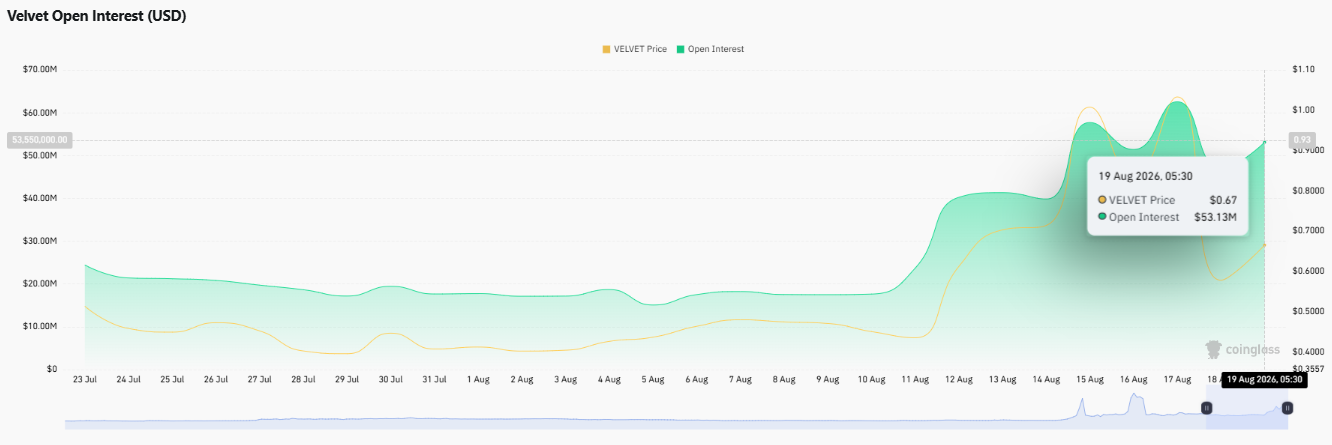
Rising open interest alongside a rising price typically points to fresh leveraged positioning rather than short covering alone.
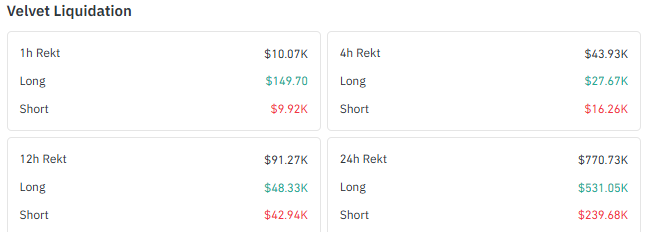
Liquidation data over the past 24 hours shows $770.73K in VELVET positions wiped out, with long liquidations of $531.05K outweighing short liquidations of $239.68K, a sign that leveraged longs bore the brunt of the pullback from recent highs.
Over shorter windows the picture flips: in the past hour, short liquidations of $9.92K dominated over longs at just $149.70, while the 4-hour and 12-hour windows show a more even split between the two sides.
Positioning data is mixed. On Binance, the VELVET/USDT long/short ratio across all accounts stands at 0.8702, meaning short positions outnumber longs among the broader trading base.
Top trader accounts show a similar lean at 0.7851, but measured by position size rather than account count, the top trader long/short ratio jumps to 1.4336, indicating that while more accounts are positioned short, the larger positions skew long.
That mixed setup is central to any VELVET price prediction built around current derivatives data.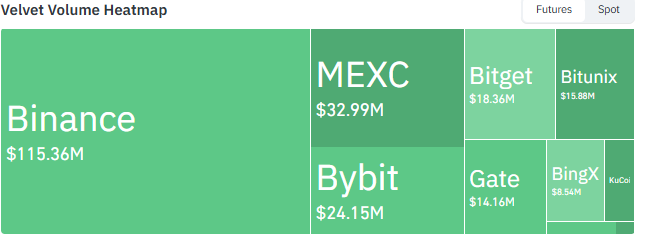
On volume, Binance dominates VELVET futures activity with $115.36M, followed by MEXC at $32.99M and Bybit at $24.15M, with smaller contributions from Bitget, Bitunix, Gate, BingX, and KuCoin rounding out the rest.
Has VELVET's Ascending Channel Run Its Course?
As per the TradingView chart, VELVET broke below the ascending channel it had been climbing inside since early August, a structure that had guided the token's rally toward its recent highs.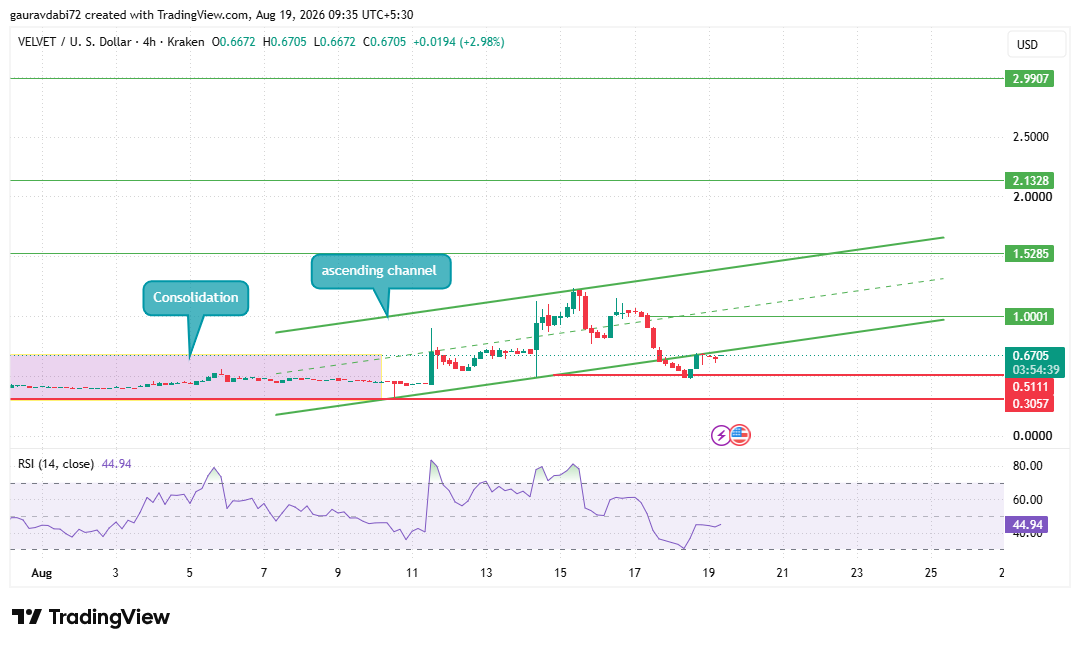
Since the break, price has taken support near $0.5111 and moved into a consolidation phase rather than extending the decline.
Buyers have so far defended this support zone on each test, and the ascending channel's lower boundary, now acting as resistance from above, sits just overhead.
A daily close back above the broken channel line, ideally on strong volume with a successful retest, would be needed to confirm a genuine reclaim rather than a temporary bounce inside the range.
Where Are the Key Support and Resistance Levels?
With price consolidating just above support, the immediate resistance to watch is $1.0001, followed by $1.5285, $2.1328, and $2.9907 if bulls manage a decisive breakout.
On the downside, $0.5111 remains the level buyers are defending; a break below it opens the door to $0.3057 as the next support.
RSI(14) is currently at 44.94, sitting just under the midpoint consistent with a market that has cooled off from overbought conditions but hasn't turned decisively bearish either.
VELVET Price Prediction: Bull, Neutral, and Bear Scenarios
Scenario
Key Levels
Bullish
A reclaim of the broken ascending channel above the $0.5111–$1.0001 zone opens the path toward $1.0001, then $1.5285, $2.1328, and $2.9907.
Neutral
Price continues to range between $1.0001 on the upside and $0.5111 on the downside without a decisive break either way.
Bearish
A break below the $0.5111 support exposes $0.3057 as the next level to watch.
VELVET's Performance Across Timeframes
Zooming out, VELVET's performance across timeframes underscores just how strong the broader trend has been.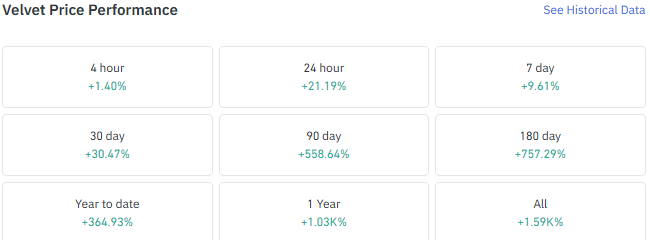
The token is up 9.61% over the past seven days, 30.47% over the past 30 days, and 558.64% over the past 90 days.
Looking further back, VELVET has gained 757.29% over six months, 364.93% year-to-date, and more than 1,030% over the past year, with an all-time gain of roughly 1,590%.
What We're Watching Next
As per the CoinGabbar analyst, the broader picture suggests VELVET's recent pullback looks more like a healthy pause than a trend reversal, given how quickly buyers stepped in to defend the range.
Derivatives data reinforces that a read of rising open interest alongside the price recovery points to fresh capital entering rather than short covering alone, though the elevated long liquidations over the past day are a reminder that leverage cuts both ways in a market still finding its footing.
For now, the balance of evidence favors continuation over breakdown, but confirmation will likely need to come from price action itself rather than sentiment alone.
Disclaimer: This article is for informational purposes only and should not be considered financial or investment advice. Cryptocurrency markets are highly volatile and carry significant risk; please conduct your own research before making any investment decisions.