What to Know VELVET surged above the Bollinger Bands midline and upper band. RSI climbed above 83, signaling strong bullish momentum. Long-term projections suggest VELVET could target $1 and
What to Know
- VELVET surged above the Bollinger Bands midline and upper band.
- RSI climbed above 83, signaling strong bullish momentum.
- Long-term projections suggest VELVET could target $1 and beyond.
Velvet (VELVET) has entered a strong bullish phase after recording a sharp breakout from its multi-week consolidation range. The latest daily chart shows the token rallying toward $0.19 after spending most of May trading below $0.12, indicating a significant shift in market sentiment and buyer activity.
Momentum indicators are also supporting the ongoing rally. The Relative Strength Index (RSI) has surged to 83.64, well above its signal line at 55.93, reflecting aggressive buying pressure. While the elevated RSI suggests overbought conditions, it also confirms that bulls currently control the trend.
Also Read: ChainGPT (CGPT) Price Prediction 2026–2030: Can CGPT Hit $0.10 Soon?
Market Structure and Price Action
VELVET spent several weeks trading within a relatively narrow range between $0.08 and $0.12 before buyers stepped in aggressively during early June. The breakout pushed the token above multiple resistance levels and triggered a rapid price expansion. The latest daily candles show VELVET climbing from around $0.10 to nearly $0.20 within a few sessions. Such a move highlights growing investor interest and increasing demand as the token establishes new local highs.
Moreover, the breakout occurred alongside a sharp expansion in the Bollinger Bands, a classic sign that volatility is increasing and a new trend may be developing. The token is currently trading well above the Bollinger mid-band, reinforcing the strength of the ongoing uptrend. As long as buyers maintain control above previous resistance levels, the broader market structure remains bullish despite the possibility of short-term profit-taking.
Technical Analysis
Technically, VELVET is displaying one of its strongest bullish setups in months. The Bollinger Bands currently show the upper band near $0.1699, the middle band around $0.1097, and the lower band near $0.0494. Notably, price has broken decisively above the upper Bollinger Band, reaching approximately $0.1936. Such moves typically indicate strong momentum, although they can also lead to temporary pullbacks as traders lock in profits.
The RSI reading of 83.64 confirms powerful bullish momentum. The indicator has crossed significantly above its moving average and entered overbought territory, reflecting strong buying activity throughout the recent breakout. Immediate support now sits near the previous breakout zone around $0.170. Additional support can be found near the Bollinger mid-band at $0.110. A deeper correction toward this level would still preserve the broader bullish structure. On the upside, resistance remains limited due to the token entering price-discovery territory. Psychological levels at $0.25 and $0.30 could become the next major targets if buying momentum continues.
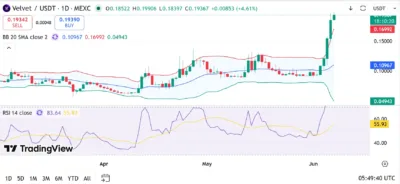
Source: Tradingview
Velvet (VELVET) Price Predictions (2026–2030)
YearMinimum PriceAverage PriceMaximum Price2026$0.15$0.30$0.502027$0.25$0.45$0.702028$0.40$0.65$1.002029$0.60$0.90$1.402030$0.80$1.25$2.00
Yearly Insights
2026
VELVET could benefit from sustained momentum and maintain prices above $0.30.
2027
Broader ecosystem growth may help the token challenge the $0.70 region.
2028
Continued adoption and stronger market conditions could support a move toward $1.
2029
Increasing demand and expansion within the crypto sector may drive further gains.
2030
If adoption accelerates and market conditions remain favorable, VELVET could target $2.
Conclusion
Velvet is experiencing a powerful breakout after spending several weeks consolidating below key resistance levels. The move above the Bollinger upper band and the sharp increase in RSI indicate that buyers currently dominate market activity.
Although short-term pullbacks remain possible due to overbought conditions, the overall structure remains constructive as long as VELVET holds above the $0.17 and $0.11 support zones. A successful continuation of the current trend could open the door for further gains toward $0.25, $0.30, and eventually the psychological $1 milestone during the coming market cycles.
FAQs
The next major resistance zones are near $0.25 and $0.30.
2. What support level is most important?
Immediate support sits around $0.17, while stronger support is near $0.11.
3. What does the RSI indicate?
The RSI at 83.64 signals strong bullish momentum but also overbought conditions.
4. Why are Bollinger Bands important for VELVET?
They help identify trend strength, volatility expansion, support levels, and potential reversal zones.
5. Can VELVET reach $1?
If adoption continues growing and bullish market conditions persist, VELVET could potentially reach $1 during the next major market cycle.
Also Read: SuperVerse (SUPER) Price Prediction 2026–2030: Can SUPERHit $1 Soon?
The post Velvet (VELVET) Price Prediction 2026–2030: Can VELVET Hit $1 Soon? appeared first on 36Crypto.