Why would VVV jump 24% in a day while spot flow turns negative? It's an odd setup. This Venice Token price prediction follows the money across exchanges at 04:12 UTC on Nov 22, 2026. Futures
Why would VVV jump 24% in a day while spot flow turns negative? It's an odd setup.
This Venice Token price prediction follows the money across exchanges at 04:12 UTC on Nov 22, 2026. Futures traders are doing the heavy lifting, and the stance here is bullish above $20.77. Earlier,VVV listing coverage tracked exchange news, but the price has moved on from that story.
Venice Token Price Prediction and the 24-Hour Data Snapshot
CoinMarketCap data puts the Venice Token price today at $24.89 at 04:12 UTC, up 23.64% over 24 hours.
Market cap is $1.22B, and volume is $71.19M, or 5.87% of market cap. FDV, the value if every token traded at today's price, is $2.02B.
The 24-hour range runs from $19.75 to $25.17. And the price still sits 27.84% below the $34.51 all-time high set in September.
VVV Technical Analysis: From the $28.34 High to the Channel Break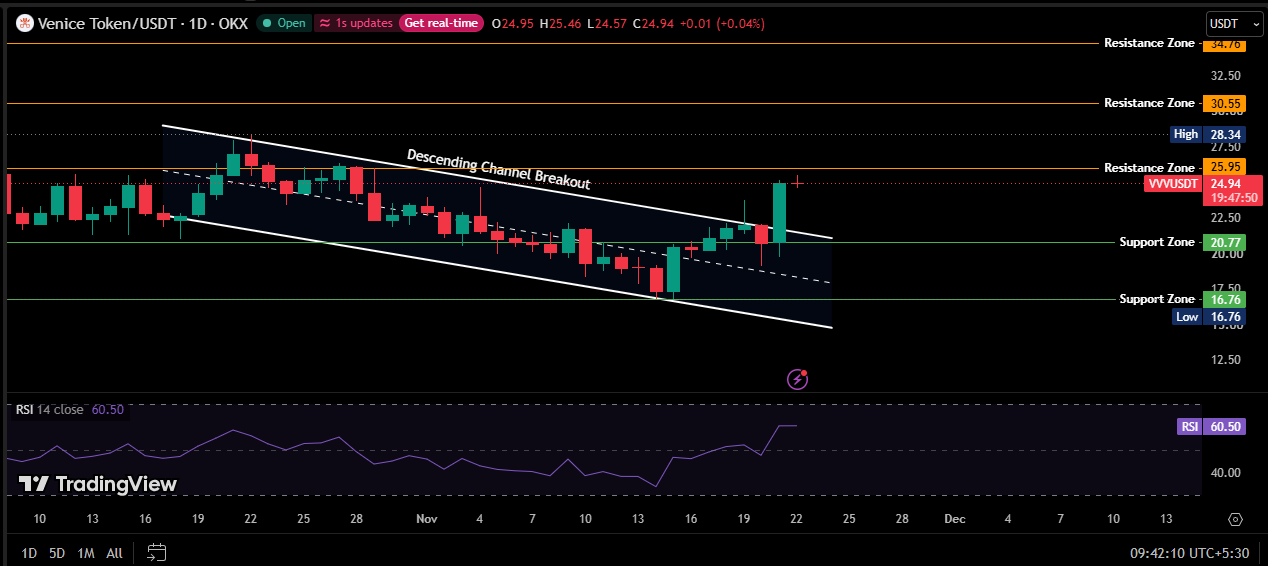
Sellers took charge in mid-October. The price hit $28.34 around Oct 21 and rolled into a descending channel, a sloping band where each high and low lands under the last. EarlierVVV channel coverage looked at this same pattern.
Price fell to $16.76 on Nov 14, the channel low.
The Nov 21 candle dipped to $19.75 before buyers drove it above the channel top near $21, and that's the descending channel breakout.
At 04:12 UTC the daily candle trades at $24.94. But $25.95 is the nearest resistance, a level where sellers tend to appear. Support, where buyers tend to step in, sits at $20.77.
RSI is 60.50 on the daily chart. Readings near 70 mark overheated trading, so there's room left.
Which Exchanges Hold the VVV Open Interest?
Open interest is the total value of futures contracts still open.CoinGlass futures data shows VVV open interest at $193.94M, up 39.31%.
Hyperliquid holds $61.59M of it, about 32%. Gate follows with $35.62M, and together the two hold roughly half.
Binance, though. It holds only $25.03M of open interest, yet leads trading at $88.01M, roughly 36% of VVV futures volume.
The taker-buyer/seller-buyer ratio tells which side hits the market harder, with buyers ahead above 1. Bybit sits at 1.1582. Gate's is 0.9676, so sellers lead there.
Did Short Liquidations Push $VVV Above $24?
Shorts got hit.
A liquidation is a forced exit when a position runs out of margin. Of the $383.17K liquidated in 24 hours, $367.30K came from shorts. These VVV short liquidations make up 96% of the total.
At first that looks like a squeeze. But $367.30K is tiny next to $193.94M of open interest, so 'squeeze' is too big a word.
September'sshort squeeze run was bigger, with $1.29M of shorts wiped in a day.
The $VVV funding rate, a fee for longs and shorts to pay each other every 8 hours, is +0.0198%, or 21.7% annualised.
Then the top traders. Binance positions show 0.8476 and Hyperliquid 0.8611, and under 1 means more shorts than longs.
$VVV Spot vs Futures and Who Is Really Buying
Futures volume is $268.24M against $37.94M on spot, a ratio of 7.1x. Spot net flow is -$212.5K, while futures net flow is +$11.0M.
So who's buying a spot?
The perp basis, the gap between perpetual and spot price, is a mild +0.105%.
The Fear and Greed index, though. It sits at 10, extreme fear, after a 24% rally. Spot depth is the missing piece, andnew exchange listings are one way it can arrive.
How Much $VVV Can Really Hit the Market?
$VVV circulating supply is 49.39M out of 81.27M total, about 61%.
Basescan holder data lists a staking contract with about 34.14M VVV and a null address with about 33.97M.
The top 100 wallets hold 97.50%, though those percentages count burnt coins too. But a burn address can't sell, and a staking contract only releases tokens when stakers withdraw. The 97.50% figure overstates the sell risk.
Venice Token Price Prediction for the Week Ahead
Bulls need a daily candle trading above $25.95. That opens to $28.34, then $30.55. Past that, $34.76 sits just above the $34.51 all-time high covered inVVV all-time high coverage.
$VVV Price Forecast Scenario Table
Scenario
Trigger
Target
Invalidation
Liquidity Condition
Bull
Daily candle above $25.95
$28.34, then $30.55
Below $20.77
Futures volume above $268.24M
Base
Price stays in range
$20.77 to $25.95
Daily candle outside the range
Volume fades from $71.19M
Bear
Daily candle below $20.77
$16.76
Reclaims $20.77
Spot outflow grows, open interest falls
What Could Break This $VVV Price Prediction?
A daily candle trading below $20.77 ends the breakout case and puts $16.76 back in play.
If spot outflow grows and futures volume fades below $268.24M, the rally loses its main source of buying. And fear at 10 means buyers can leave fast.
Token news in theAI crypto news feed can move price quickly.
Can $VVV Reach $28.34 After This Breakout?
This $VVV price prediction leans bullish, while the price holds $20.77, but the move stays unconfirmed until a daily candle trades above $25.95. Next stop is $28.34.
Futures money leads. Spot buyers haven't joined yet, and that gap decides how long the move lasts. More setups sit on thelatest crypto price predictions page.
Disclaimer: This article is for information only and isn't financial advice. Crypto prices swing fast, so traders should do their own research and risk only what they can afford to lose.
