What to Know Verified Emeralds trades near $26.01 following a powerful October breakout, with its daily price gaining 30.12% amid strong buying momentum. VEREM’s RSI stands at 87.29, indicati
What to Know
-
Verified Emeralds trades near $26.01 following a powerful October breakout, with its daily price gaining 30.12% amid strong buying momentum.
-
VEREM’s RSI stands at 87.29, indicating overbought conditions, while expanding Bollinger Bands reflect increased volatility following the recent price surge.
-
Holding above $19.36 could support further gains toward $30, while a sustained correction could expose lower support levels around $15.
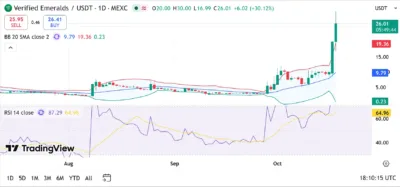
Verified Emeralds (VEREM) trades near $26.01, with its daily chart showing a substantial October breakout following several months of relatively stable price movement. According to TradingView chart, VEREM has climbed significantly above its 20-day Bollinger Band average at $9.79, while the latest daily candle shows a 30.12% increase.
Recent trading activity pushed VEREM to an intraday high of $30, marking a considerable increase from its earlier trading range below $10. The latest candle opened near $20 before buyers drove prices higher, reflecting strong upward momentum.
The Relative Strength Index stands at 87.29, considerably above its moving average of 64.96 and the traditional overbought threshold of 70. These readings indicate exceptionally strong bullish momentum, although they also suggest an increased possibility of profit-taking following the rapid advance.
Also Read: Monero Price Nears $558 Resistance as XMR Rally Builds Momentum Toward $575
Market Structure and Price Action
Verified Emeralds’ daily chart shows relatively stable trading throughout late July and early August, with prices largely fluctuating between $3 and $4. Buying activity strengthened during August, briefly pushing VEREM above $6 before prices returned to a narrower consolidation range.
September trading remained relatively subdued, with VEREM fluctuating around $3 to $5 as buyers struggled to establish sustained upward momentum. Nevertheless, October brought a significant change in market structure as successive bullish candles pushed prices above $10.
The latest breakout accelerated the rally, lifting VEREM toward $30 before prices settled near $26.01. This movement represents a substantial departure from the earlier consolidation range and indicates increased buying activity.
Despite the bullish structure, the rapid advance has created considerable distance between the current price and the Bollinger Band midline at $9.79. Maintaining support around $20 could allow buyers to stabilize prices and attempt another move toward $30.
A sustained breakdown below $20 could expose support around $19.36, followed by the $15 region. Conversely, renewed buying pressure could push VEREM above $30, potentially opening a path toward $35.
Bollinger Bands Indicate Extreme Volatility
VEREM trades considerably above its Bollinger Band midline at $9.79, indicating that bullish momentum has strengthened substantially following October’s breakout. The current price also exceeds the upper Bollinger Band at $19.36, reflecting an unusually extended upward movement.
The lower Bollinger Band stands near $0.23, creating an exceptionally wide separation between the upper and lower boundaries. This expansion reflects elevated volatility following the cryptocurrency’s substantial price increase.
A sustained breakout above $30 could strengthen bullish expectations and potentially expose resistance around $35 and $40. Breaking above these levels would improve the possibility of advancing toward the psychological $50 target.
Reaching $50 would require an increase of approximately 92.23% from the displayed price of $26.01, making sustained buying pressure and stronger market participation essential. Nevertheless, trading above the upper Bollinger Band does not guarantee continued appreciation, as sharp upward movements can also precede significant corrections.
RSI Signals Strong but Overextended Bullish Momentum
The RSI reading of 87.29 indicates exceptionally strong bullish momentum, with the indicator positioned considerably above the traditional overbought threshold of 70. Its position above the moving average of 64.96 further confirms the strength of recent buying activity.
The indicator previously fluctuated around neutral levels during August and September before climbing substantially during October’s rally. This movement corresponds with the successive bullish candles visible on VEREM’s daily chart.
An RSI reading above 80 can persist during powerful upward trends, although such elevated levels increase the risk of short-term corrections. Consequently, traders may monitor whether VEREM maintains its recent gains or experiences renewed selling pressure.
A decline toward 70 could indicate cooling momentum without necessarily ending the broader bullish structure. Conversely, sustained RSI strength alongside a breakout above $30 would support expectations of additional upside. For VEREM to maintain its bullish outlook, buyers would need to defend the $20 region while establishing stronger support above the previous trading range.
Source: TradingView
VEREM Price Predictions (2026–2030)
Year
Minimum Price
Average Price
Maximum Price
2026
$10.00
$25.00
$40.00
2027
$12.00
$30.00
$50.00
2028
$15.00
$38.00
$65.00
2029
$18.00
$45.00
$80.00
2030
$20.00
$55.00
$100.00
Yearly Insights
2026
VEREM’s remaining 2026 outlook depends on maintaining support around $20 and overcoming resistance near $30. A sustained breakout could support an advance toward $35–$40, while renewed selling pressure could expose the $15 and $10 regions.
2027
Improving cryptocurrency market conditions and sustained demand for VEREM could support a recovery toward $50 under a bullish scenario. Establishing support above $30 would strengthen this possibility, although weaker market participation could restrict prices to lower trading ranges.
2028
A broader cryptocurrency market expansion could allow VEREM to challenge $65 if buying activity and trading liquidity strengthen. Reaching this level would require sustained demand and greater market participation, while unfavorable conditions could keep prices considerably lower.
2029
The bullish scenario places VEREM near $80 if stronger demand and favorable cryptocurrency market conditions support additional appreciation. Nevertheless, prolonged bearish conditions or declining liquidity could limit price movement toward the lower projected range.
2030
A favorable long-term scenario allows VEREM to approach $100, provided sustained demand and broader cryptocurrency adoption support additional market participation. Nevertheless, the current daily chart does not provide technical confirmation or a reliable timetable for reaching this valuation.
Conclusion
Verified Emeralds maintains a strongly bullish technical structure, with its price trading near $26.01, considerably above the Bollinger Band midline at $9.79. The RSI reading of 87.29 confirms powerful buying momentum, although elevated overbought conditions increase the possibility of a correction.
A sustained breakout above $30 could support another advance toward $35 and $40, potentially opening a path toward $50. Nevertheless, reaching this target would require approximately 92.23% additional growth, while losing support around $20 could expose VEREM to a deeper correction.
FAQs
1. What is the immediate support level for VEREM?
The nearest potential support stands around $20, followed by the upper Bollinger Band at $19.36. A sustained breakdown below these levels could expose the $15 region.
2. What is the next major resistance for VEREM?
VEREM faces immediate resistance near its recent intraday high of $30, followed by potential psychological resistance around $35 and $40. Breaking above these levels could expose $50.
3. What does VEREM’s RSI indicate?
The RSI reading of 87.29 indicates exceptionally strong bullish momentum. Nevertheless, its position above the traditional overbought threshold of 70 suggests an increased possibility of profit-taking or a short-term correction.
4. Can VEREM reach $50 before 2030?
VEREM could reach $50 under favorable market conditions, although achieving this target would require approximately 92.23% growth from its displayed price. Sustained buying pressure, stronger liquidity, and continued bullish momentum would be necessary.
5. Why is the Bollinger Band midline important?
The Bollinger Band midline at $9.79 represents VEREM’s 20-day moving average and helps identify the prevailing short-term trend. Trading considerably above this level indicates strong upward momentum, although the substantial price separation also highlights increased correction risks.
Also Read: SEC Chair Paul Atkins Vows Comprehensive Crypto Rules as CLARITY Act Faces Setback
The post Verified Emeralds (VEREM) Price Prediction 2026–2030: Can VEREM Hit $50 Soon? appeared first on 36Crypto.