Weak employment figures give crypto markets a lift, while a veteran analyst spots a technical setup that could signal the end of Bitcoin's months-long slide. The leading cryptocurrency pushed
Weak employment figures give crypto markets a lift, while a veteran analyst spots a technical setup that could signal the end of Bitcoin's months-long slide.
The leading cryptocurrency pushed past $62,000 on July 2 after U.S. jobs data came in far below expectations, offering bulls some relief following weeks of heavy losses.
The Bureau of Labor Statistics reported that the U.S. economy added just 57,000 jobs last month. The unemployment rate held steady at 4.2%, with 7.1 million people out of work.
Related: Trump's annual filing reveals over $1 billion in income outside real estate
A pattern worth watching
As markets digested the numbers, John Bollinger, the legendary American financial analyst and trader who created Bollinger Bands in the 1980s, flagged a technical formation developing on Bitcoin's daily chart that has caught the attention of traders.
Bollinger Bands are a widely used tool in technical analysis that measures market volatility and helps identify when an asset is trading at a relatively high or low price.
Bollinger is also the founder and president of Bollinger Capital Management and authors the Capital Growth Letter.
He pointed to a "W" pattern, also called a double bottom, forming on Bitcoin's chart. The shape typically appears at the end of a downtrend and is read by traders as a possible sign that selling pressure is running out.
"$BTC has seen a series of bullish patterns broken, evidence of the power of the downtrend," Bollinger wrote on X. "Will this 'W' be the one that breaks the trend?"
Trending on TheStreet Roundtable:
What makes this setup different
What Bollinger finds notable about this particular pattern is its fractal nature, meaning smaller versions of the same shape are nested within the larger one.
"Here is a chart highlighting a developing 'W' pattern in $BTC," he wrote. "Note that it is perfectly fractal. There are small 'w's at the nadirs and a small 'm' at the apex."
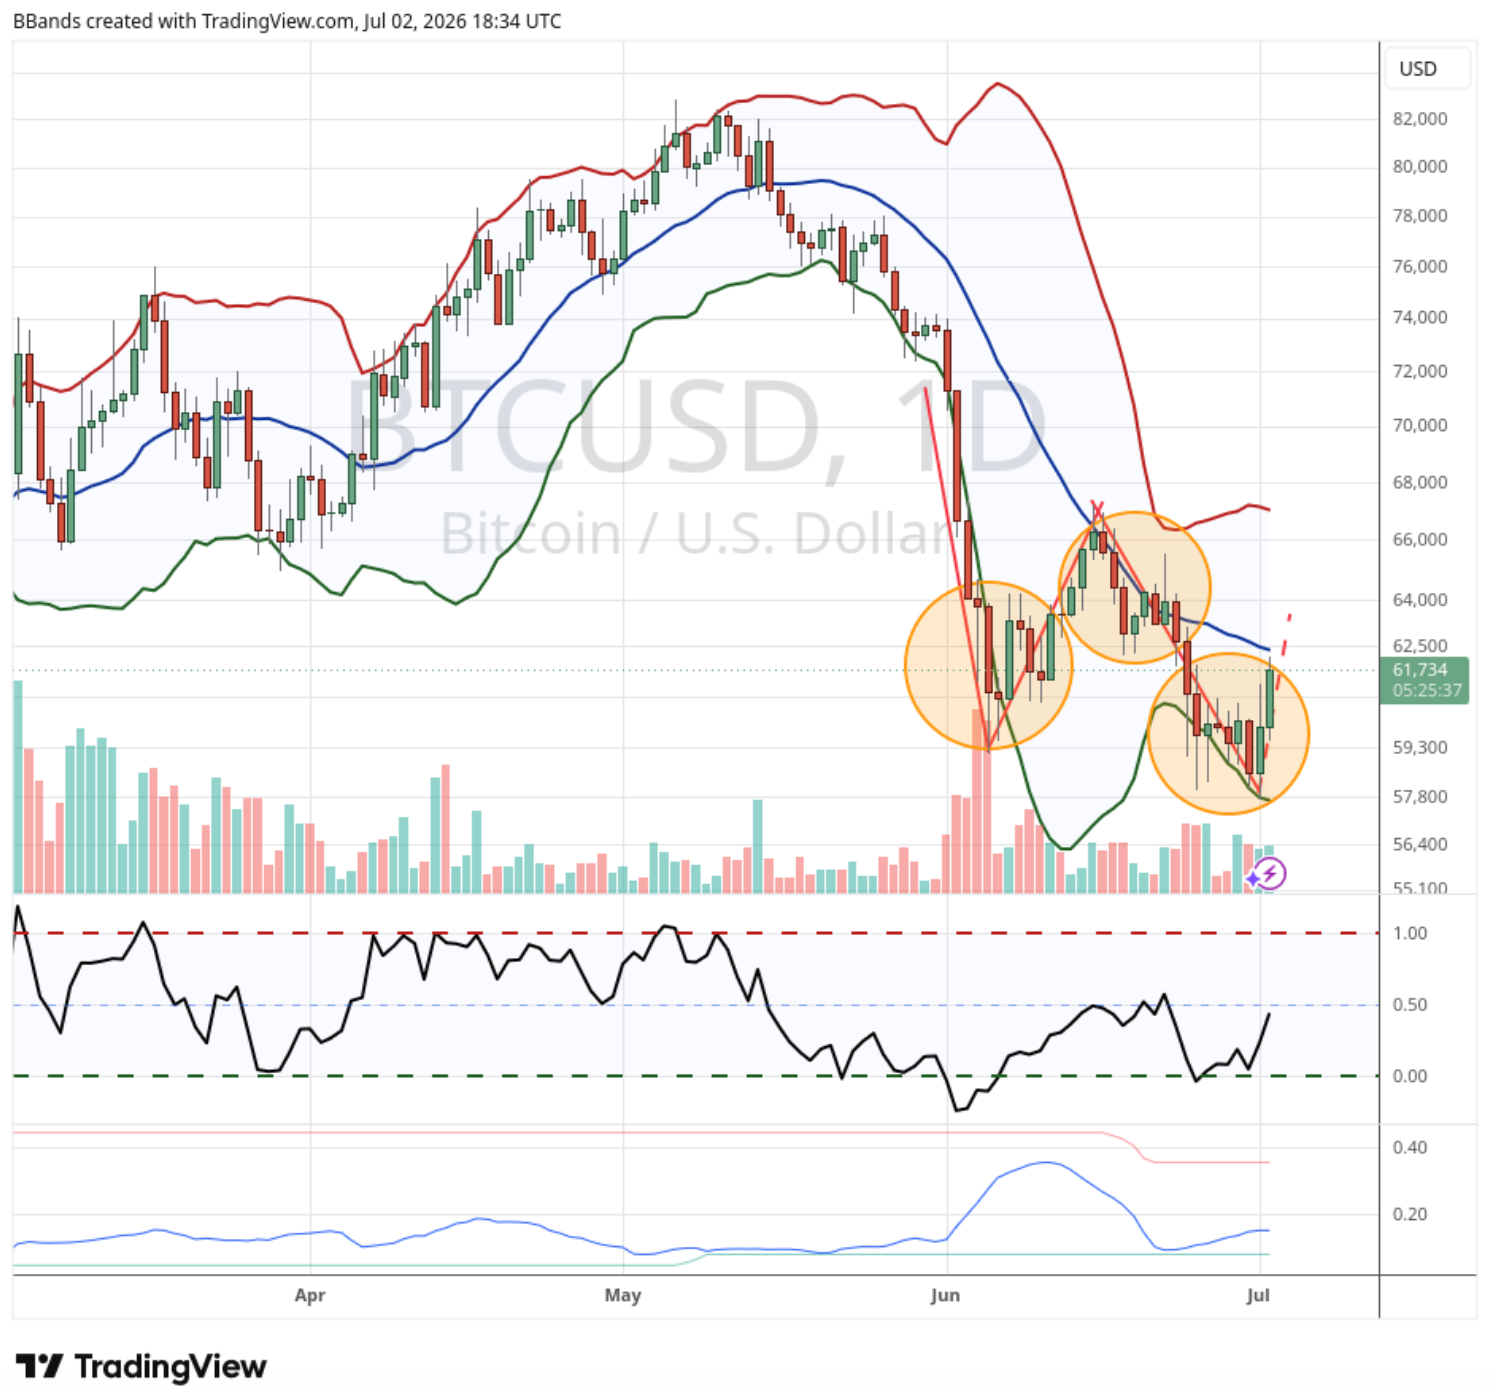
Bitcoin analysis chart shared by John Bollinger on July 2
The pattern took shape after Bitcoin suffered a series of sharp drops following a failed attempt to reclaim $82,000 in May. Each selloff pushed prices into the lower boundary of the Bollinger Bands, gradually forming a three-stage base.
Bollinger also pointed traders to the weekly chart, where the entire daily correction appears to be carving out just the second leg of a far larger "W" playing out over a longer timeframe.
A breakout above the $65,000 apex would be needed to confirm the pattern and signal a meaningful shift in trend.
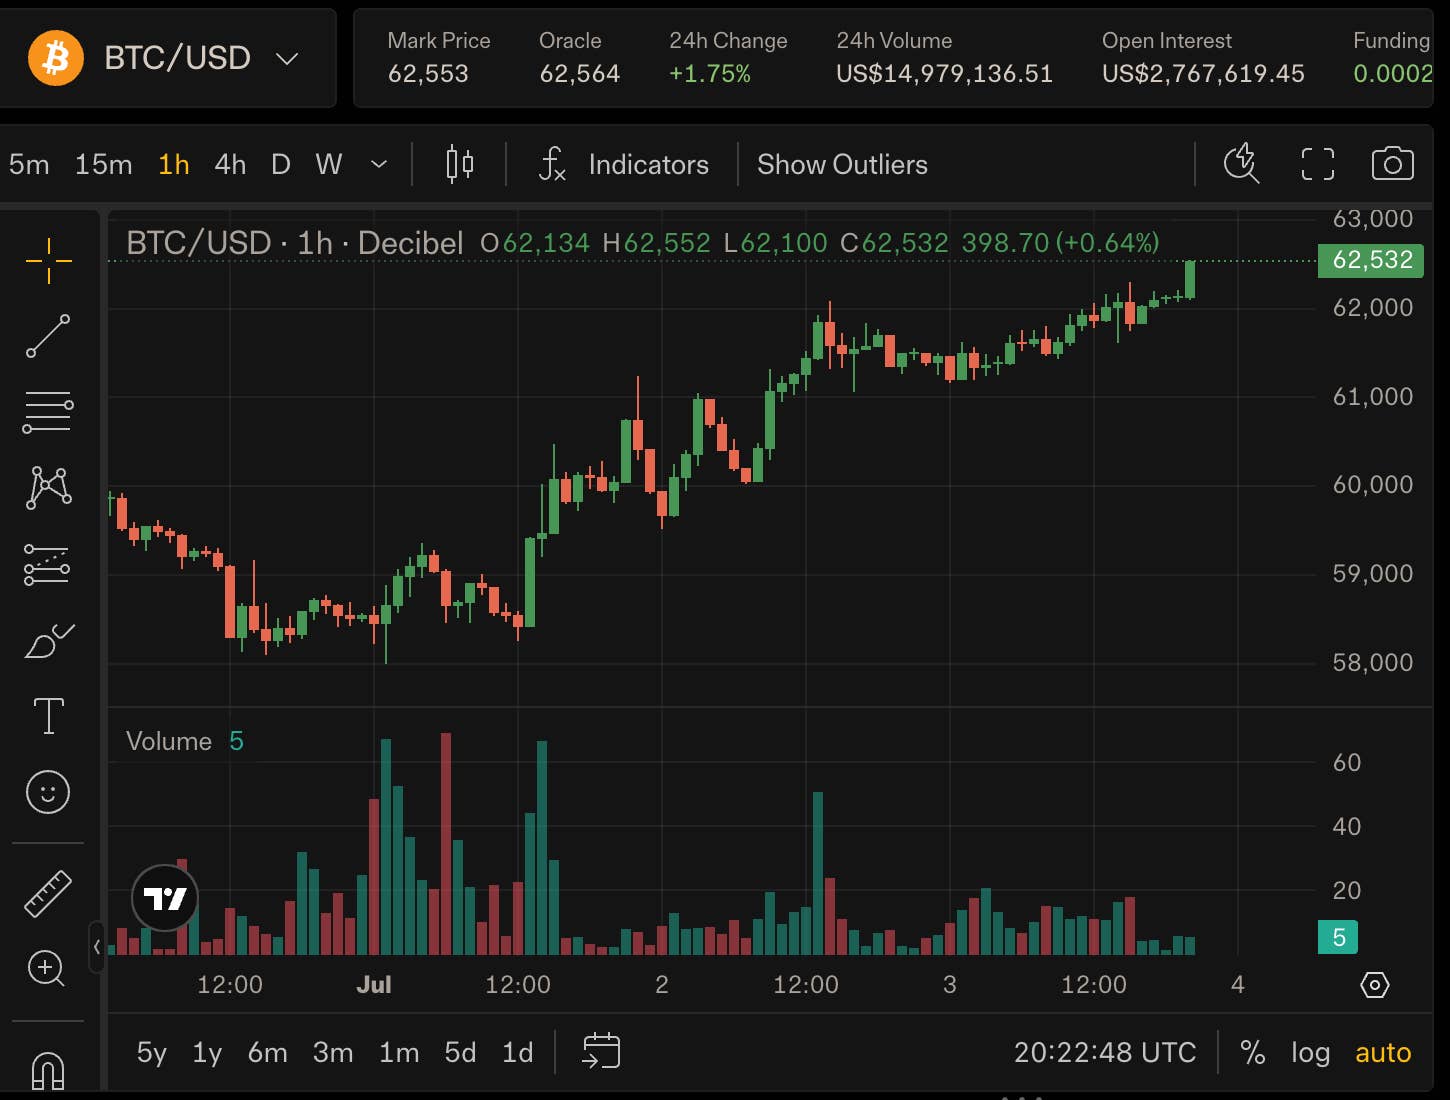
Bitcoin price at the time of writing on June 3. Source:
DecibelDecibel
At the time of writing on July 3, Bitcoin was trading at $62,532, still weighed down by persistent ETF outflows and broader macro uncertainty.
Related: Popular Tesla investor blames Trump for Bitcoin crash