
Markets3 min read
Gaining Momentum
LUNC price forecast is getting more interesting amid stability in terms of technology and a number of developments within the ecosystem. Short-term dynamics are highly volatile, but market pa
What to Know WAVES rebounded from lower Bollinger Band support near $0.24. RSI climbed toward 50, signaling improving bullish momentum. Long-term projections suggest WAVES could reclaim the $
Waves (WAVES) is showing signs of stabilization after enduring a prolonged downtrend that pushed the token to its lowest levels of the year. The latest TradingView data shows WAVES trading near $0.299, recovering from a recent low near the lower Bollinger Band support zone.
Momentum indicators are beginning to improve as buyers gradually return to the market. The Relative Strength Index (RSI) has climbed toward the neutral 50 level after spending several sessions in bearish territory, suggesting selling pressure is weakening.
The latest bullish candle has also pushed WAVES closer to the Bollinger Band midline resistance. While the broader trend remains cautious, the recovery attempt indicates that market participants are actively defending support levels following the steep June decline.
Also Read: DeepNode (DNODE) Price Prediction 2026–2030: Can DNODE Hit $5 Soon?
WAVES traded within a relatively stable range throughout April and May, holding near the $0.40–$0.45 region. However, sellers gained control during late May, triggering a sharp correction that erased several weeks of gains.
The decline accelerated during June as a series of bearish candles pushed the token below the Bollinger Band midpoint around $0.277. Market sentiment deteriorated further as WAVES continued making lower highs and lower lows.
Eventually, the token found support near the lower Bollinger Band around $0.241. Buyers responded aggressively at this level, producing a rebound that lifted prices back toward $0.30. Although the recovery remains modest, the rebound has prevented a deeper breakdown and improved short-term market structure.
Technically, WAVES is attempting to reclaim momentum after bouncing from oversold conditions. The Bollinger Band midpoint currently sits near $0.277 and has already been reclaimed, providing the first bullish signal in several weeks.
The upper Bollinger Band near $0.314 now serves as the next major resistance level. A successful breakout above this area could open the door for a stronger recovery toward the $0.35 region.
Meanwhile, support remains firmly positioned around $0.241 near the lower Bollinger Band. Losing this level would likely expose WAVES to another round of selling pressure and potentially drive prices toward new yearly lows.
The RSI currently stands at 49.05 while its moving average is near 35.36. This reading shows momentum has improved significantly from recent lows and is approaching neutral territory. Historically, RSI recoveries toward 50 often indicate growing buyer participation and a possible trend reversal when accompanied by strong price support.
The immediate resistance level remains at $0.314. A breakout above this zone could strengthen bullish momentum and pave the way toward higher resistance levels. On the downside, maintaining support above $0.241 remains critical for preserving the recovery structure.
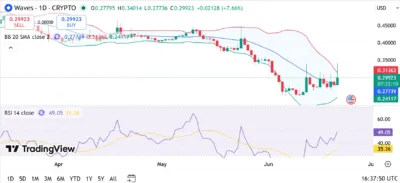
Source: Tradingview
WAVES could remain volatile while attempting to establish a stronger base above the $0.24 support region and gradually recover toward $0.65.
Improving investor sentiment and broader market recovery could support a move toward the $0.90 level.
A favorable cryptocurrency cycle may help WAVES reclaim the important $1 milestone and strengthen long-term momentum.
Continued ecosystem development and growing blockchain adoption could drive further upside for the token.
If market conditions remain supportive, WAVES could challenge the $2 region during an extended bullish cycle.
WAVES is attempting to recover after a steep correction pushed the token close to oversold conditions. Recent price action and improving RSI readings suggest bearish momentum may be fading as buyers return to defend key support levels. The $0.241 support zone remains the most important area to monitor in the near term. As long as this level holds, WAVES could continue building a foundation for a broader recovery.
A decisive breakout above the $0.314 resistance level would significantly improve the technical outlook and increase the probability of a move toward higher price targets. While risks remain elevated, the long-term outlook favors gradual appreciation if adoption grows and overall market sentiment improves.
The nearest support level is located around $0.241 near the lower Bollinger Band.
Immediate resistance sits near $0.314 at the upper Bollinger Band.
The RSI reading of 49.05 suggests momentum is improving and bearish pressure is weakening.
The midpoint often acts as dynamic support or resistance and helps determine the prevailing trend direction.
Long-term projections suggest WAVES could reclaim $1 if market conditions improve and buyers continue defending key support levels.
Also Read: Aerodrome Finance (AERO) Price Prediction 2026–2030: Can AERO Hit $2 Soon?
The post Waves (WAVES) Price Prediction 2026–2030: Can WAVES Hit $1 Soon? appeared first on 36Crypto.