Zcash (ZEC) price traded at around $426 at press time, slipping nearly 10% over the past 24 hours as traders continued to digest the recent market-wide volatility. Despite the short-term weak
Zcash (ZEC) price traded at around $426 at press time, slipping nearly 10% over the past 24 hours as traders continued to digest the recent market-wide volatility. Despite the short-term weakness, the token remains well above its March lows, with investors closely watching whether the latest pullback is merely a correction within a broader uptrend.
Interestingly, sentiment among sophisticated market participants appears to be shifting. A prominent crypto whale who was previously bearish on ZEC has turned bullish. At the same time, momentum indicators suggest that selling pressure may be fading even as prices consolidate.
With whale positioning turning bullish and technical indicators showing early signs of stabilization, traders are now watching whether ZEC can resume its rally or face another leg lower.
Whale Flips From Short to Long, Signaling a Shift in Market Sentiment
One of the biggest developments for Zcash in recent days has come from Garrett Jin, who has reversed his market stance by switching from a bearish position to a bullish one. As per the data from Lookonchain, the trader opened a 2x leveraged long position on 27,723 ZEC, valued at approximately $11.9 million.
Although the position is currently sitting on an unrealized loss of around $812,000, that figure is less important than the change in conviction. Rather than closing positions and moving to the sidelines, the whale has chosen to establish a sizable long exposure despite ongoing market volatility.
ZEC Price Analysis: Technical Indicators Suggest the Selling Pressure Is Fading
Although ZEC has pulled back sharply from its recent highs, the broader technical structure remains constructive as the token continues to trade above its rising trendline support. The recent decline appears to be a correction after testing the major $680-$700 resistance zone, rather than a confirmed reversal of the broader uptrend.
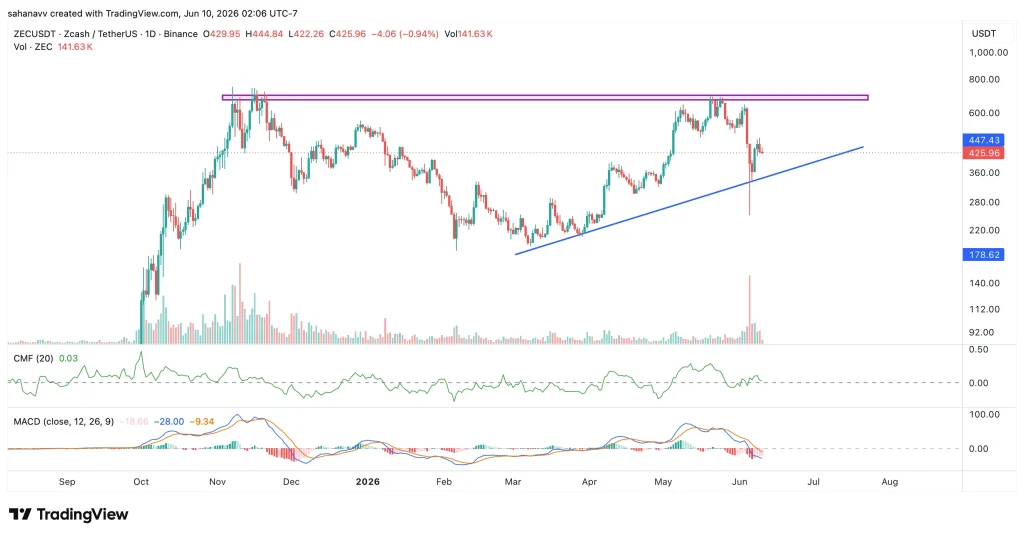
The Chaikin Money Flow (CMF) has been gradually improving, forming a series of higher lows and small higher highs despite the recent price weakness. The MACD also points to improving momentum. While the indicator remains in negative territory following the recent selloff, the histogram and signal lines indicate that selling pressure is gradually fading.
This suggests that capital inflows remain relatively resilient and that buyers continue to accumulate as selling pressure is gradually fading. In other words, bears are losing momentum even as ZEC continues to consolidate below its recent highs.
Wrapping it Up—Will ZEC Reclaim $500 or Slip Back Below $400?
The battle is now centered around whether ZEC can convert the recent pullback into another higher low or lose momentum and trigger a deeper correction. The whale’s shift from short to long and improving momentum indicators provide a constructive backdrop, but price action remains the ultimate confirmation.
If buyers continue defending the rising trendline, it may reclaim the psychological $500 level. A sustained move above that zone could then open the door for another attempt toward the major resistance area around $680-$700. On the downside, however, traders should closely monitor the $400 level.