What to Know UP remains below the Bollinger Band middle line, showing sellers still control the broader trend despite recent stabilization. RSI has recovered to 37.30, indicating bearish mome
What to Know
- UP remains below the Bollinger Band middle line, showing sellers still control the broader trend despite recent stabilization.
- RSI has recovered to 37.30, indicating bearish momentum is weakening although buying pressure remains relatively limited for now.
- A sustained move above the 20-day moving average could improve the stock’s long-term recovery outlook toward higher resistance level
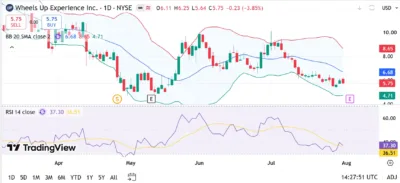
Wheels Up Experience Inc. (NYSE: UP) remains under pressure after an extended decline, with the latest TradingView daily chart showing the stock trading around $5.75. Although recent sessions suggest selling pressure has eased, price continues trading beneath the Bollinger Band middle line, highlighting that bulls have yet to regain full control of the broader trend. Meanwhile, the 14-day Relative Strength Index (RSI) has recovered to 37.30, signaling that bearish momentum is gradually fading.
The recent price action reflects several months of lower highs and lower lows, interrupted only by brief recovery attempts. While buyers have defended the lower Bollinger Band near recent lows, stronger momentum will be needed before the stock can establish a sustained upward trend.
Also Read: Collect on Fanable (FAN) Price Prediction 2026–2030: Can FAN Hit $0.100?
Buyers Look for a Stronger Recovery
UP has spent much of the past several months in a persistent downtrend as repeated rallies failed to overcome key resistance levels. However, the latest rebound from the lower Bollinger Band suggests buyers are attempting to build a short-term base after the recent selloff.
The stock still trades below the 20-day moving average near $6.68, while the upper Bollinger Band around $8.65 remains the primary resistance zone. Reclaiming these technical levels would improve market sentiment and could attract additional buying interest.
Although volatility has narrowed compared with previous weeks, the Bollinger Bands indicate that another significant move could develop once price breaks decisively above resistance or below support.
Technical Outlook
Technical indicators continue favoring caution despite early signs of stabilization. The RSI reading of 37.30 remains below the neutral 50 level, showing buyers are gradually returning but have not yet established strong momentum.
The lower Bollinger Band near $4.71 continues serving as the nearest support level. Holding above this region could encourage further consolidation, while a breakout above the middle Bollinger Band near $6.68 would strengthen the bullish outlook and open the path toward the upper band around $8.65. If selling pressure returns, the stock could revisit recent lows before another recovery attempt develops.
Source: Tradingview
Wheels Up Experience (UP) Price Prediction (2026–2030)
YearMinimumAverageMaximum2026$5.20$6.50$8.202027$6.10$7.80$10.002028$7.00$9.30$11.802029$8.20$10.90$13.602030$9.50$12.80$15.50
Price Forecast by Year
2026
If UP holds above the lower Bollinger Band and reclaims the 20-day moving average, the stock could gradually recover toward $8.20.
2027
Improving financial performance and stronger investor confidence could allow UP to challenge the $10.00 psychological resistance level.
2028
A broader market recovery and sustained buying momentum may help the stock advance toward $11.80 while establishing a stronger long-term trend.
2029
Continued operational improvements and higher trading activity could support a move toward $13.60 if bullish momentum remains intact.
2030
If Wheels Up successfully maintains long-term growth and market sentiment continues improving, the stock could target approximately $15.50.
Conclusion
Wheels Up Experience is showing early signs of stabilization after months of sustained selling pressure, but the broader trend remains bearish while price trades below the middle Bollinger Band and the 20-day moving average.
The RSI has improved from oversold conditions, suggesting downside momentum is fading. However, buyers must reclaim key resistance around $6.68 and eventually break above $8.65 before a stronger long-term recovery toward the $10 region becomes increasingly likely.
FAQs
1. Is UP currently bullish?
Not yet. The stock is stabilizing, but it remains below important resistance levels that must be reclaimed before confirming a bullish trend.
2. Why is the RSI reading of 37.30 important?
It indicates bearish momentum is weakening and the stock is moving away from oversold conditions, although buying strength remains limited.
3. What are the key resistance levels?
The middle Bollinger Band near $6.68 and the upper Bollinger Band around $8.65 are the primary resistance levels.
4. Can UP reach $10 by 2030?
If the company sustains operational improvements, market sentiment strengthens, and the stock breaks above major technical resistance, reaching $10 is achievable within the forecast period.
5. What risks could limit UP’s upside?
Weak earnings, broader market weakness, failure to reclaim the 20-day moving average, and renewed selling pressure could delay or reverse the recovery.
Also Read: Anoma (ANOMA) Price Prediction 2026–2030: Can ANOMA Hit $0.020 Soon?
The post Wheels Up Experience (UP) Stock Price Prediction 2026–2030: Can UP Rebound to $10? appeared first on 36Crypto.