Gold price is trading around $4,017 per ounce as of July 19, down from the January highs above $5,600. The metal has been in a correction for months, but beneath the surface, something import
Gold price is trading around $4,017 per ounce as of July 19, down from the January highs above $5,600. The metal has been in a correction for months, but beneath the surface, something important is happening.
China is slowly stockpiling gold at a much faster pace than official figures show.
The Kobeissi Letter reported that China acquired +48 tonnes of gold in May via the London OTC market. That is the biggest monthly purchase in over a year, according to Goldman Sachs estimates. This figure is 4.8x larger than the official +10 tonnes reported by China’s central bank for May.
China’s central bank officially added another +15 tonnes of gold in June , marking its largest monthly purchase in at least 2.5 years and its 20th consecutive month of reserve increases.
Year-to-date, China has officially raised its gold reserves by +40 tonnes. But applying a more conservative 2.0x ratio to that year-to-date figure indicates China may have actually accumulated closer to ~80 tonnes of gold so far in 2026.
China’s real gold purchases are far above what official figures indicate. The country is stockpiling gold through the London OTC market, away from the public eye. The scale of this accumulation means a strategic shift toward de-dollarization and reserve diversification.
Gold Price Analysis This Week
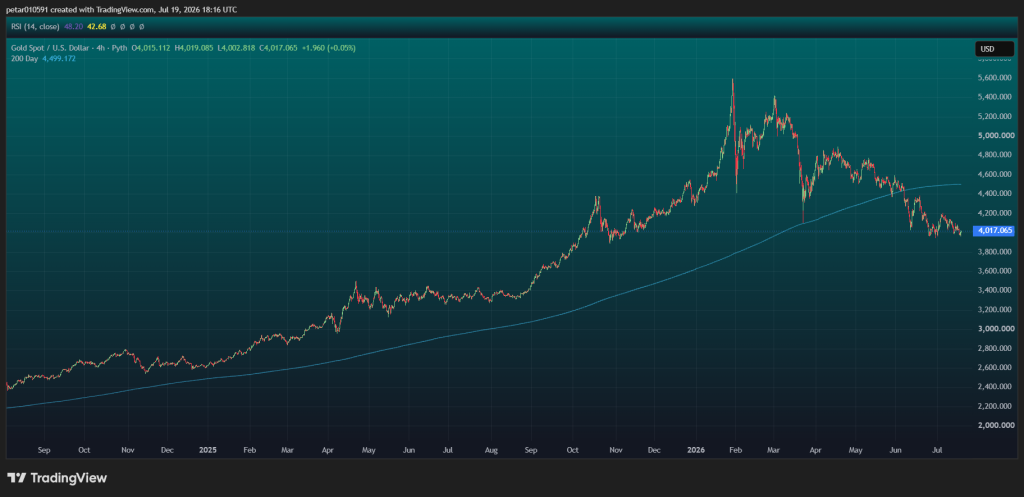
The 4‑hour chart attached to the report shows gold trading at $4,017.065 at press time, up 0.05% in the session. The metal has been in a consolidation phase after the sharp correction from the January highs above $5,600.
Key technical observations:
Price action: Gold has been forming a series of lower highs and higher lows, creating a descending channel. The current gold price is near the lower end of this channel which could lead to a potential bounce.
The 200‑day moving average: The 200‑day MA IS at 4,499.172– nearly $500 above the current price. That is a massive gap that confirms the bearish trend. Gold has not traded above its 200‑day MA since early June. A reclaim of this level would be the strongest bullish signal.
RSI: The RSI on the 4‑hour chart reads 48.20 , with a previous reading of 42.68. That is neutral to slightly bullish. The RSI has been climbing from oversold territory, which means selling pressure is easing.
 Source: TradingView
Support zones:
- Immediate support: $4,000 (psychological level) – this has been tested multiple times and held so far
- Strong support: $3,973 (recent swing low) – this is the level that marked the previous bottom
- Next support: $3,800 and $3,600 if $4,000 breaks
Resistance zones:
- First resistance: $4,100 – the current ceiling of the descending channel
- Second resistance: $4,250 – a major level that has rejected price multiple times
- Major resistance: $4,500 – the 200‑day MA area that would confirm a trend change
What the chart is telling me: Gold is in a bearish trend but showing signs of stabilization near $4,000. The RSI is improving. The 200‑day MA is still far above price. The trend is down until gold breaks above $4,100 and then $4,250.
Read also: Robert Kiyosaki Just Made a Massive Gold and Silver Price Prediction
Gold Price Prediction for This Week
The China buying data is bullish for gold in the long term. The country is accumulating gold at a record pace. That provides a structural floor under the price.
But the short-term technicals are still bearish. The 200‑day MA is far above price. The descending channel is still intact. Gold needs to break above $4,100 to confirm a reversal.
Bullish scenario: the Gold price holds $4,000 support and breaks above $4,100. That would open the door to $4,200 and then $4,300. A break above $4,300 would be the strongest signal bulls have had in weeks.
Neutral scenario: the Gold price trades between $4,000 and $4,100 for the week. Low volume. No clear direction. This is the most likely outcome.
Bearish scenario: the Gold price breaks below $4,000. That would trigger a move toward $3,900 and then $3,800. A break below $3,800 would signal a new leg down in the bear trend.
Our take: The China buying data is a long-term bullish signal. The country is accumulating gold at a pace that indicates serious concern about the dollar’s role as a reserve currency. But the short-term price action is still in a bear trend. Gold needs to break above $4,100 to show any real strength.
I am not buying gold here yet. I want to see a break above $4,100 and then $4,250 before committing. But I am watching closely. The structural demand from China is real.
Subscribe to our YouTube channel for daily crypto updates, market insights, and expert analysis.
The post Where Gold Price Might Go This Week as China Raises Its Gold Reserves Again appeared first on CaptainAltcoin.