Bitcoin has experienced a sharp, sudden correction, breaking down from its recent consolidation range to test lower macro support levels. The premier cryptocurrency plummeted toward the $71,0
Bitcoin has experienced a sharp, sudden correction, breaking down from its recent consolidation range to test lower macro support levels. The premier cryptocurrency plummeted toward the $71,000 threshold, leaving traders questioning whether the psychological support at $70,000 will hold or if a broader market liquidation is underway.
The drop comes at a highly ironic moment for market participants, arriving right alongside major capital restructuring updates from Michael Saylor’s Strategy (formerly MicroStrategy).
Bitcoin Price Analysis: What Happened to BTC Coin?
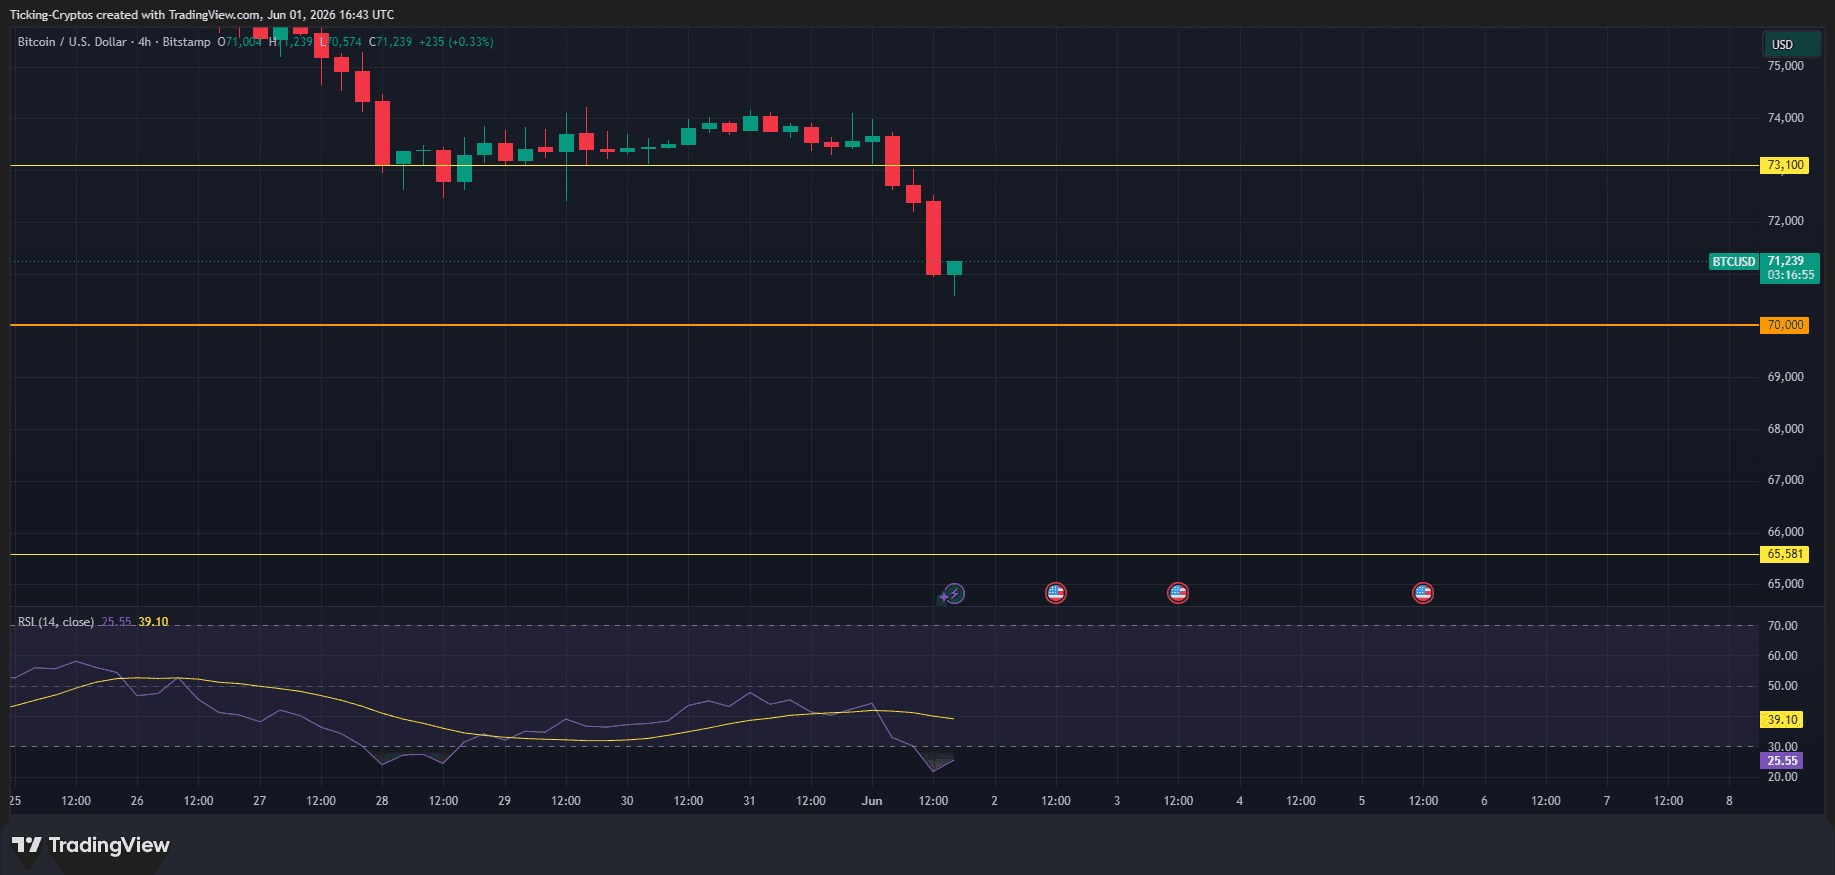
The 4-hour BTC/USD chart paints a distinctly bearish picture for the short term. After spending days consolidating in a tight distribution phase between $73,100 and $74,500, the bears aggressively seized control.
Key Support and Resistance Levels
- Immediate Resistance ($73,100): This level served as a firm baseline support throughout the final week of May. Now that the price has sliced cleanly beneath it, this yellow horizontal line will act as major overhead resistance on any corrective relief rallies.
- The Crucial Floor ($70,000): This is the ultimate line in the sand for bullish continuation. A breakdown past this psychological milestone could trigger cascading stop-losses and a deeper correction toward the next macro structure level at $65,581.
RSI Flashes Deep Oversold Signals
The Relative Strength Index (RSI-14) has plunged sharply down to 25.55, steering well into oversold territory. While an oversold RSI indicates that the immediate selling pressure may be overextended, it also demonstrates intense bearish momentum. In severe downtrends, the RSI can remain suppressed for extended intervals before a meaningful reversal materializes.
Michael Saylor is the Only Buyer, Not the Only Seller
A significant point of discussion during this downward move is the structural dynamic of institutional accumulation versus broader market distributions. Michael Saylor's Strategy recently made headlines by shifting a massive $2.0 billion through capital markets to aggressively stack another 24,869 Bitcoins, bringing their total holdings to a staggering 843,706 $BTC.
However, the broader market quickly realized a fundamental structural flaw: Saylor may be the most persistent buyer, but he is not the only market participant.
While Strategy acts as a persistent vacuum for circulating supply, systemic liquidity factors are overriding this single-source buying power:
- Spot ETF Exhaustion: Broader spot $Bitcoin ETFs have seen fluctuating inflows, failing to sustain the massive upward momentum observed earlier in the year.
- Macro Capital Demands: In an unexpected twist, SEC filings revealed that Strategy even executed a minor, rare sale of 32 Bitcoins ($2.5 million) to fund corporate preferred stock dividend obligations. While a drop in the bucket, it shattered the psychological illusion of an absolute "never-sell" floor.
- The Supply-Demand Imbalance: When retail traders, miners, and short-term speculators decide to take profits simultaneously, even a multi-billion-dollar corporate treasury bid cannot absorb the entire global sell volume single-handedly.
What is Next for Bitcoin?
The next several daily closes will be pivotal for BTC. If buyers fail to step in and orchestrate a swift recovery back above the $72,000 mark, the gravitation toward $70,000 will become irresistible.
Traders should monitor global macroeconomic indicators, upcoming U.S. economic data releases, and spot ETF net inflow data on tracking platforms like CoinMarketCap to gauge if retail and institutional interest will return to defend the $70,000 baseline.