The Pi Network (PI) price remained under heavy selling pressure, falling 5.8% over the past 24 hours to trade at $0.0857, after slipping to an intraday low of $0.0850. The decline came on tra
The Pi Network (PI) price remained under heavy selling pressure, falling 5.8% over the past 24 hours to trade at $0.0857, after slipping to an intraday low of $0.0850. The decline came on trading volumes of 38.18 million PI, extending the token’s multi-day losing streak and pushing it below the key $0.10 psychological support level.
The latest sell-off adds to PI’s broader bearish trend, with the token continuing to post lower highs and lower lows over recent months. As selling pressure intensifies and buyers struggle to defend key support levels, traders are wondering: What’s driving Pi Network’s latest decline, and are there any signs that the downtrend is nearing an end?
Why Is Pi Network Price Falling?
Pi Network’s latest decline isn’t the result of a single event. Instead, the recent weakness reflects a combination of fundamental and technical factors that have continued to weigh on investor sentiment and keep sellers firmly in control.
- Token unlocks continue to increase circulating supply, adding fresh selling pressure as more holders gain access to their coins.
- Buying demand remains weak, making it difficult for the market to absorb the additional supply.
- PI has broken below key technical support levels, triggering fresh selling and weakening market sentiment.
- Limited exchange listings and ecosystem adoption continue to weigh on investor confidence.
- The broader bearish market structure remains intact, with lower highs and lower lows encouraging traders to sell rallies rather than buy dips.
PI Price Action Signals Further Downside Risk
Pi Network’s latest sell-off has pushed the token below the $0.10 psychological support, a level that had held up over the past few weeks. Trading around $0.0857, PI is now hovering near its multi-month low of $0.0850, reflecting the lack of buying interest despite the sharp decline. The move also reinforces the broader downtrend, with the chart continuing to print lower highs and lower lows.
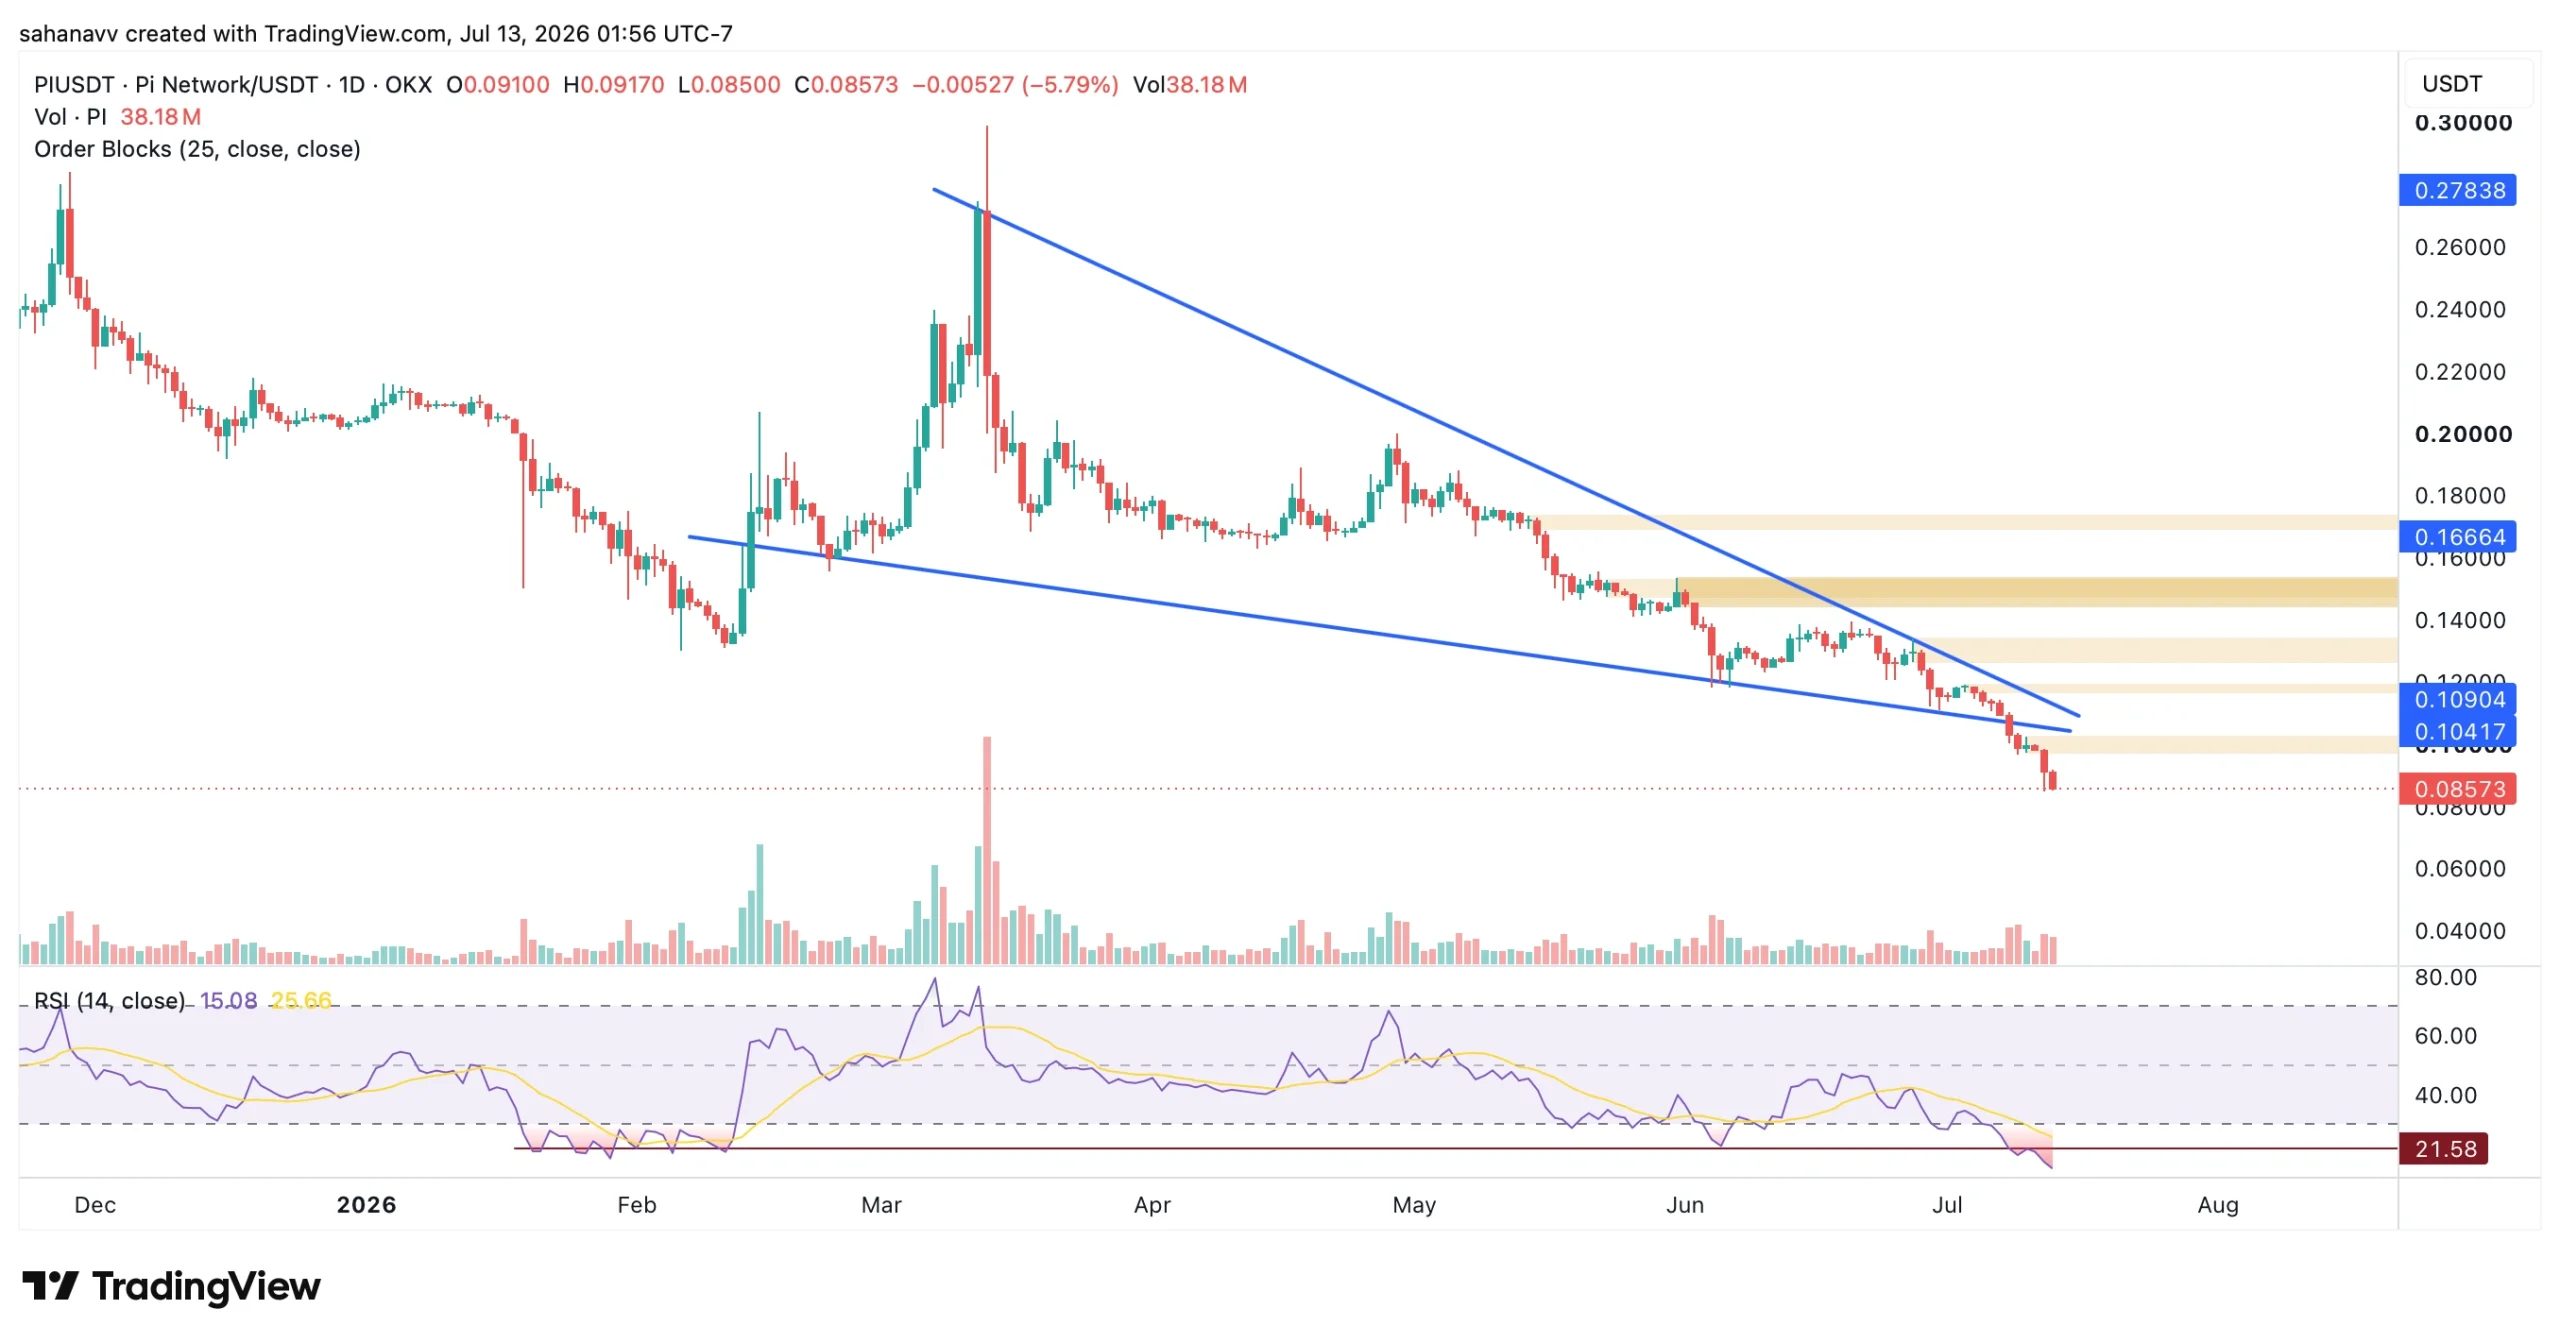
The rejection from the descending wedge resistance further strengthens the bearish outlook. Instead of breaking higher, PI rolled over from the upper trendline and accelerated lower, suggesting sellers remain active on every recovery attempt. Adding to this, the breakdown was accompanied by a noticeable increase in trading activity, indicating that larger market participants were active during the move rather than it being driven solely by retail selling.
On the other hand, the RSI has dropped to the lowest range not seen since the start of the year. Although it has not displayed any bullish divergence, these types of pullbacks usually result in a strong rebound. From an order-flow perspective, the $0.104-0.109 region now becomes the first bearish order block, where any relief rally is likely to encounter fresh supply.
What Lies Ahead for PI?
Pi Network remains one of the weakest-looking charts in the altcoin market. The breakdown below the $0.10-0.109 range, rejection from the descending wedge resistance, and lack of strong buying interest suggest that sellers continue to dictate the trend. Until buyers reclaim key resistance levels, the path of least resistance remains to the downside.
For bulls, the first challenge is to reclaim the $0.10 psychological level, followed by the $0.104-0.109 bearish order block. A successful breakout above this zone could fuel a recovery towards $0.145-0.150, while a move above $0.166 would mark the first meaningful shift in the broader market structure.
On the bearish side, failure to defend the $0.080-0.082 support zone could accelerate selling pressure and push PI into fresh all-time lows. For now, the technical evidence favours trend continuation over trend reversal, meaning traders should treat any near-term bounce as a relief rally until price proves otherwise by reclaiming key resistance levels with strong volume.