Stellar's native token XLM closed at $0.2628 on June 1, 2026, after a 73.4% week-over-week rally that began on May 27 when DTCC announced plans to tokenize a portion of DTC-custodied assets o
Stellar's native token XLM closed at $0.2628 on June 1, 2026, after a 73.4% week-over-week rally that began on May 27 when DTCC announced plans to tokenize a portion of DTC-custodied assets on the Stellar network. According to DAO Times, the price action puts XLM in the top 22.7% of all closing values in its Binance-era trading history, with realized volatility running at 249% annualized against a long-term average of 99%. The dominant xlm news today across CoinDesk, Coinpaper, and PR Newswire coverage reduces to a single line, that DTCC, the depository sitting on $114 trillion of custodied assets, is moving onto a public blockchain for the first time and choosing Stellar.
The explanation circulating for why is stellar up today contains several factual errors that the market has priced as truth, and the structural setup behind the rally matches a template that has produced systematic losses for late buyers in every prior iteration on this exact chart.
What the DTCC announcement actually says
The May 27 release from DTCC and the Stellar Development Foundation, published through PR Newswire, confirms a planned integration that would make DTC-custodied securities available on Stellar in the first half of 2027. According to CoinDesk's coverage of the announcement, the project rests on a no-action letter that the SEC issued to DTCC in December 2025, covering tokenization of a defined set of highly liquid assets including Russell 1000 components, major index ETFs, and US Treasuries. The live-availability window sits 12 to 14 months ahead of the announcement date, with no launched product at the moment of the rally.
The headline figure of $114 trillion comes from DTC's total assets under custody, with no committed tokenization volume attached to it. According to reporting from The Coin Republic and a detailed regulatory breakdown by Genfinity, the no-action letter's scope is narrow by design, since the SEC's framework explicitly limits the eligible asset universe to mainstream liquid instruments where regulatory precedent is well-established.
Genfinity additionally points out that the DTCC patent governing this work, US20250078065A1, references hierarchical delegation rights and explicitly names XRP Ledger as a candidate venue alongside Stellar. DTCC chose Stellar as the first integration in a multi-chain roadmap that also includes other networks. According to The Coin Republic's reporting, DTCC has signaled parallel work with Digital Asset and Canton Network, and the depository plans to retain clearing, netting, and systemic risk management on its existing infrastructure regardless of which chains carry the tokenized assets.
The selection criteria are also worth reading literally. Nadine Chakar of the Stellar Development Foundation, quoted across Coinpaper and CryptoNews.com coverage, framed the decision around Stellar's compliance-oriented architecture, the protocol's clawback functions, restricted-transfer features, and its operational track record with institutions such as MoneyGram and Circle's USDC. None of those criteria reference the XLM token. They reference protocol features that DTCC values for institutional risk management.
How the xlm dtcc narrative falls apart on value capture
Here the stellar dtcc framing collides with the actual architecture of the network. Settlement of tokenized DTC assets on Stellar will occur in USDC, which serves as the native dollar-denominated settlement asset for compliant institutional flows on the network. According to a structural analysis published by Crypto Daily, Stellar's transaction fees of 0.00001 XLM per operation are intentionally minimized for usability, and a hypothetical scenario of one billion transactions per year produces around $100 in total fee revenue paid in XLM at current prices.
End users of a tokenized Russell 1000 product or a tokenized Treasury fund have no structural reason to hold XLM beyond a trivial balance for fees, and treasurers at issuing institutions can automate that fee provisioning without taking directional XLM exposure. The tokenized assets themselves are issuer liabilities denominated in fiat-equivalent terms, which means the XLM token receives no automatic flow from tokenization volume. Crypto Daily's framing on this point is direct. The drivers of XLM value capture under the DTCC roadmap would have to come from secondary effects such as liquidity provisioning, custodial adoption, and durable user inflows, none of which scale linearly with tokenized AUM.
A separate analysis from Bitget cites Vincent Van Code, a long-time analyst covering institutional blockchain integrations, summarizing the structural issue as "network activity does not equal token price." The same logic applies to the current setup. The DTCC integration creates network activity. The XLM token does not receive demand from that activity through any automatic mechanism.
The short squeeze that did the actual lifting
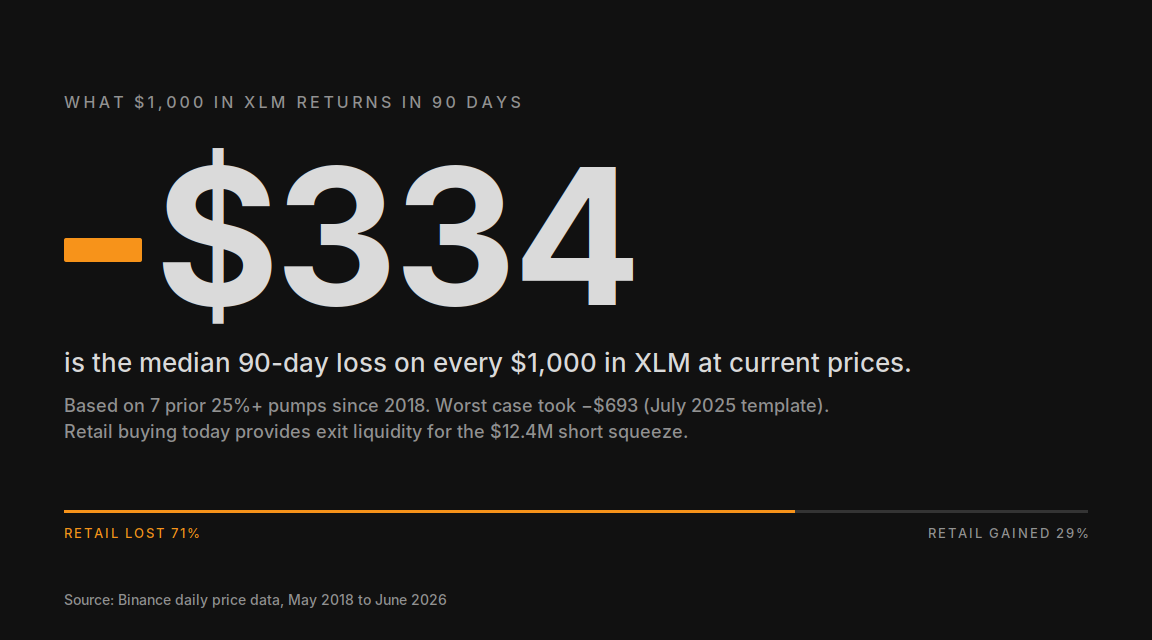
Stocktwits data and an rwatimes Substack analysis published in late May both document that approximately $12.4 million in short positions were forcibly liquidated on XLM derivatives venues between May 27 and May 30. CoinGape and FXStreet reporting from the same period confirms that XLM's funding rate moved into negative territory at minus 0.0126% on a weighted basis at the rally's peak, which is the signature of short sellers continuing to position bearish even after taking liquidation losses.
The mechanical implication matters for anyone reading the move as organic accumulation. Forced buying from stop-outs produces the same green candles as conviction buying does, but the source of the bid disappears once short positioning is cleared out. After May 30, the funding-rate evidence shows that fresh shorts have re-entered, which means the market structure has returned to a configuration where rallies require either new long inflows or another round of short coverage. The latter source is finite by definition.
The xlm dtcc narrative provided the spark, with the magnitude of the move coming from leveraged bears getting flushed, separate from any spot accumulation. On-chain spot exchange inflows reported by CoinMarketCap on May 27 actually rose against a falling broad-market backdrop, which is consistent with holders sending coins to venues for distribution.
Volume sequence and the chart structure
Daily XLM volume printed 917 million units on May 28, then declined to 850 million on May 29, 720 million on May 30, and 546 million on May 31. On June 1, intraday volume sits near 141 million on a partial session. The volume profile across the rally shows distribution, since buyers absorbed less and less supply on each successive attempt at a new high. This is the volume signature of an exhausting move, with no acceleration component in the data.
The May 30 daily candle is the structural pivot. Intraday high of $0.2982, close at $0.2296, a long upper wick with the close near the session low, representing a 23% drawdown from high to close inside a single 24-hour window on the largest volume of the entire move. This is a failed test of the $0.30 psychological level, which represents the highest closing zone XLM has held since November 10, 2025. June 1 produced a high of $0.2744, sitting below May 30's high. The daily chart has printed a lower high.
According to CoinPedia's technical tracking, the 14-day RSI sits at 79.12 and the Stochastic oscillator at 81.82, with both indicators deep in territory that has historically preceded mean reversion on XLM specifically and on altcoins broadly. CryptoTimes coverage of the same failed retest at $0.30 reaches the same conclusion on indicator positioning, and represents one of the most-trafficked sources currently answering xlm news today queries on the rally's sustainability.
Base rates from the chart since 2018
A statistical pass over XLM's full daily history on Binance, covering 2,924 sessions from May 31, 2018 forward, produces a base rate that bears reading carefully. Across all seven prior episodes when XLM produced a single-day return of 25% or more, the median forward 30-day return was negative 2.7%, the median forward 60-day return was negative 13.3%, and the median forward 90-day return was negative 33.4%. The two episodes that produced positive 90-day outcomes, November 2020 and November 2024, both occurred during broad-market crypto uptrends, with Bitcoin printing new all-time highs in adjacent windows. Without that tailwind, every other 25%+ single-day move has faded.
The same dataset shows eight prior weekly rallies of 50% or more in XLM since 2018. The median 30-day forward return after those episodes was negative 7.7%, with five of the eight episodes producing negative 30-day outcomes. Two of the three positive outcomes (2020 and 2024) again align with broad crypto bull-market windows. The current rally has produced a 73% weekly return inside a sideways global crypto tape where Bitcoin has not made a new all-time high in 2026. Statistically, the current setup contains the weakest configuration of preconditions for sustained altcoin price expansion that the data covers.
The July 2025 precedent that maps directly onto current conditions
The closest historical comparison to the current setup sits less than 12 months back on the same chart. In June and July of 2025, XLM rallied from a low of $0.2168 on June 22 to a peak of $0.5206 on July 18, an increase of 140.1% in 26 days. The catalysts were Protocol 23 rc2 deployment and the market expectation of PYUSD integration through PayPal. By December 31, 2025, XLM closed at $0.2010, representing a 61.4% drawdown from the July peak. The local Q4 2025 low was $0.16, putting the actual peak-to-trough decline at 69.3%.
The current episode has produced a 99% rally from the May 23 low in four days, compressing roughly the same amplitude into a fraction of the prior duration. Volume at the May 28 peak (917M XLM) exceeded the July 13, 2025 peak-volume session (712M XLM), which suggests that fuel for the move has been spent faster, with no implication that demand sits deeper. According to CryptoPotato's historical coverage, the same template ran in October 2021 around the MoneyGram partnership announcement, with XLM peaking at $0.364 before declining 80% over the following 18 months. Three iterations of the same pattern in five years, with consistent post-peak drawdowns in the 60% to 80% range.
The supply side that no one prices in
According to Changelly's research on Stellar tokenomics and CoinMarketCap data, the Stellar Development Foundation treasury holds approximately 30 billion XLM, equivalent to roughly 60% of the total supply, allocated for ecosystem development and grant distribution. In 2025 alone, SDF distributed $14.4 million worth of XLM to 154 ecosystem projects, and those tokens flow into circulating supply through grant recipients who routinely sell to fund operations.
There is no burn mechanism on the Stellar network. The inflation mechanism was disabled in 2019, though token issuance from the SDF treasury continues, which produces a structurally one-directional supply flow. This matters specifically in episodes of weakening demand. The SDF distributions do not stop because price falls. They run on a programmatic schedule tied to grant commitments, which means the supply overhang functions as a continuous headwind against any consolidation or recovery once organic demand fades.
The combination of factors above creates an asymmetric risk profile for leveraged long positions that compounds across each dimension. Realized volatility at 249% annualized, per the prior 7-day window, means that intraday range expectations sit roughly two-and-a-half times higher than long-term norms, and stop placements that would be considered conservative under standard conditions become trivially easy to take out on routine intraday moves. The May 30 candle alone showed a 23% high-to-close swing inside one session. A 5x or 10x leveraged long opened anywhere above $0.25 with a stop below the session low would have been liquidated mid-candle on May 30, even though the daily close held above $0.22.
The negative funding rate environment, per FXStreet and CoinGape readings, means that long position holders are paying short sellers to maintain exposure, which produces continuous time decay against directional bets. On a perpetual contract held for 30 days at minus 0.0126% per 8-hour funding period, the cumulative cost runs to roughly 1.4% of notional exposure in funding payments alone, equivalent to a 14% loss on a 10x leveraged position before any price movement.
The historical base rate of negative 33.4% median 90-day return after similar episodes, multiplied across leverage, produces expected returns that are structurally negative for any position held into the typical post-rally consolidation window. A 10x leveraged long that experiences the median historical outcome would lose its entire notional within the first 30 days, since intraday volatility around that median produces drawdowns well below the close-to-close measurement, and the structural supply pressure from SDF distributions ensures that even sideways consolidation involves continuous mark-to-market drag.
The public-positioning side of the market reflects this analysis in real time. According to crypto analyst Coach JV in commentary tracked by CoinPedia, rotation flows out of XRP into XLM on the back of one DTCC headline reflect a structural misreading of the announcement, since the integration sits 12 months ahead and DTCC's roadmap is multi-chain by design. Substack-published critique from rwatimes documents the same point with on-chain receipts of the short squeeze magnitude.
Retail attention to why is stellar up today has concentrated on Korean exchanges, where Upbit volume drove an outsized share of the May 28 candle, according to volume distribution data tracked by CoinMarketCap. Trader commentary aggregated from late May and early June on X reflects the opposite positioning at the professional level. @mohhady framed the move as "a misleading trap" with a target return to $0.05, @xau_trader77 documented short positions as "exit liquidity" for retail, @cryptodog786 forecast continued downside into 2026, and @elong_tusks noted that the abnormal pump itself is bearish signal for a network where token mechanics do not capture utility growth. The convergence between technical analysts, on-chain commentators, and derivatives traders points in one direction.
The structural conclusion
The DTCC announcement is a legitimate long-term narrative for Stellar as a network. The integration, if executed on the announced timeline, would represent a meaningful institutional validation of the protocol's compliance architecture and put real assets on a public blockchain for the first time at scale. None of that is in dispute, and none of it is contradicted by the analysis above.
The dispute centers on the translation of that narrative into XLM token price over a 12-month-or-less horizon. The market has priced 12 months of execution risk, 12 months of regulatory implementation work, and 12 months of competitive uncertainty (Canton, Digital Asset, XRPL all sitting in the same DTCC patent envelope) as if go-live is tomorrow. The short squeeze that lifted the price has cleared. The volume profile shows distribution. The technical structure has produced a lower high. The funding rates point to continued bearish positioning from professionals. The historical base rates produce uniformly negative expected returns across multiple lookback windows. The supply overhang from SDF runs continuously and in one direction. The July 2025 template, which produced an identical setup and resolved in a 69% drawdown, represents the only piece of historical evidence that maps cleanly onto current conditions, and its outcome sits along the path of least resistance.
The synthesis for any investor weighing a leveraged long at current levels is direct. The reasons for the move are real, and the reasons have been fully priced and then over-priced. The mechanism that produced the gains (short coverage) cannot repeat at the same scale. The chart structure has rolled over. The statistical comparison set produces negative expected returns. Leverage amplifies every dimension of the disadvantage.
The pre-announcement consolidation zone of $0.15 to $0.18, which produced the base of the current rally, sits 31% to 43% below current price. The July 2025 episode resolved at a level that was roughly equivalent in percentage terms below its peak, on the same chart, with the same underlying token, under similar institutional-narrative conditions. The base case for the next 60 to 90 days, statistically and structurally, points back to that zone.