The bounce from $0.89 was enough to put $1 back in reach for XRP. Holding it has been the problem. On the four-hour Bitstamp chart shared by More Crypto Online, XRP briefly traded around a do
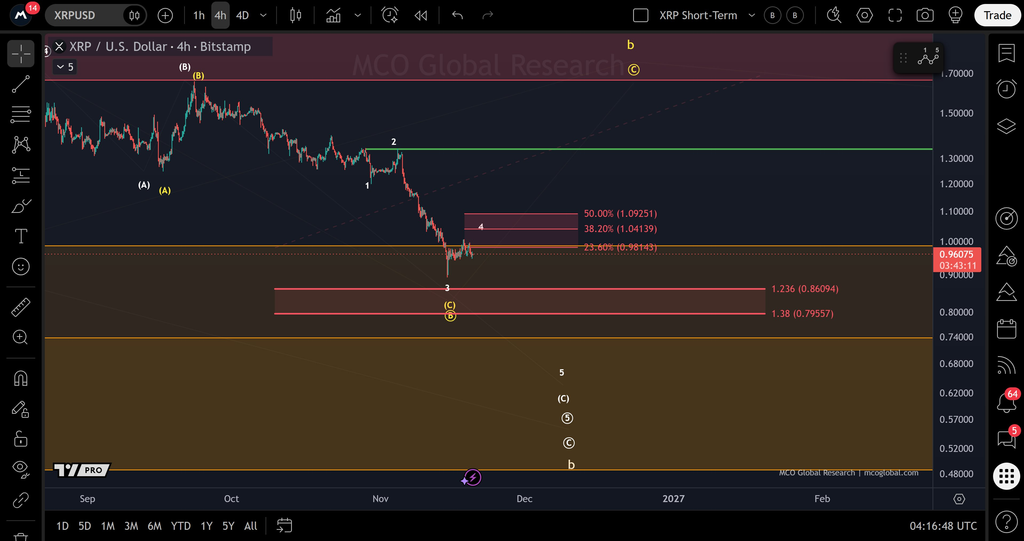
The bounce from $0.89 was enough to put $1 back in reach for XRP. Holding it has been the problem. On the four-hour Bitstamp chart shared by More Crypto Online, XRP briefly traded around a dollar before slipping back to $0.96. Buyers had given up ground at almost the exact price the analyst was watching: $0.981.
More Crypto Online thinks XRP could make one more low. I’d look for buyers around $0.86 if $0.89 gives way. That’s about 10% below the price in the chart. A drop to $0.80 is possible too, though I’d want to see how XRP trades around $0.86 before putting much weight on it.
Why XRP Is Down Again
XRP was already falling before the Federal Reserve released its October meeting minutes on November 18. An early-November rally had stalled near $1.33, well below the September high. By the time buyers stepped in around $0.89, XRP had lost roughly a third of its value from that November rebound alone.
The Fed minutes gave buyers little reason to hurry back. Officials remained concerned about inflation and leaned toward raising rates again. On November 19, more than 90% of S&P 500 stocks closed lower. Investors were selling across much of the market, and that made for a difficult week for an asset already struggling to hold a rally.
What Would a Move Above $1 Mean for XRP?
More Crypto Online counts the bounce from $0.89 as a possible fourth wave. In plain terms, the analyst thinks the recovery could run a little further before sellers push the XRP price to one last low. The white numbers on the chart trace that scenario.
 Source: X/@Morecryptoonl
The rebound so far has been modest relative to the selloff. At $0.981, XRP would have recovered just 23.6% of the measured decline. Even at $1.041, it would have regained only 38.2%. That leaves plenty of room for XRP to trade above a dollar and still follow the path the analyst laid out.
The level that would change the analyst’s view is closer to $1.093. It marks the halfway point of the decline. More Crypto Online favors another leg down as long as XRP stays below it. A sustained move above $1.093 would put that forecast in doubt.
Read also: XRP Price Is Flashing a Rare On-Chain Signal!
How Low Can XRP Go From $0.96?
The recent low near $0.89 is the first price I’d watch. Just under it, the chart marks a Fibonacci extension at $0.861. Only three cents separate those levels, which leaves room for XRP to briefly undercut its low and recover. If buyers push it back above $0.89 within a few hours, I’d give another run at $0.981 a fair chance.
I’d take the $0.80 scenario more seriously if XRP falls through $0.86 and then struggles to get back above it. The next extension on the chart is $0.796, about 17% below the $0.96 shown on Bitstamp. The analyst also places a fifth-wave label below $0.74, though the post gives no firm target that low.
My view is that $0.86 is the more plausible downside level if selling resumes. Buyers showed up around $0.89 once. How quickly they return if XRP trades three cents lower will tell us more about the risk of $0.80 than another brief trip above a dollar.
For more crypto news and price predictions, click here.
Subscribe to our YouTube channel for daily crypto updates, market insights, and expert analysis.
The post Why Is XRP Price Down Again and How Low Can XRP Dip? appeared first on CaptainAltcoin.