If you are comparing liquidity pools, TVL is usually the first number that catches your attention. A pool with $5 million locked looks very different from one with $500,000. But TVL only tell
If you are comparing liquidity pools, TVL is usually the first number that catches your attention.
A pool with $5 million locked looks very different from one with $500,000. But TVL only tells you how much capital is sitting inside the pool. It does not tell you how actively that capital is being used, how much fee-generating activity is happening, or what risks come with the underlying assets.
That distinction matters.
A large TVL figure can tell you that a pool has substantial liquidity. It cannot, by itself, tell you whether that liquidity is being used efficiently.
TVL, or Total Value Locked, represents the value of assets held in a pool. On STONFI, it is an important indicator of available liquidity and can help you understand the depth of a market. Higher liquidity can generally support larger swaps with less price impact, all else being equal.
But there is a second question that TVL does not answer:
How much trading is actually happening?
Consider two hypothetical pools:
Pool A has ten times more liquidity.
But dividing volume by TVL gives:
That does not automatically make Pool B the better pool. It simply reveals a difference that TVL alone hides: the smaller pool is processing considerably more trading activity relative to the capital sitting inside it.
And that matters because swaps, not deposits themselves, generate trading activity and associated LP fees.
A pool can hold millions in liquidity while seeing relatively little trading.
Another pool can hold a fraction of that amount while processing significant volume.
This is why the volume-to-TVL ratio can be useful as a secondary metric:
Volume / TVL = 24-hour trading volume ÷ TVL
It is not a guaranteed return metric, and it should not be treated as a prediction.
What it does provide is context.
A low ratio may indicate that a large amount of liquidity is currently supporting relatively little trading activity. A high ratio indicates that more trading is taking place relative to the liquidity available.
The important part is not just calculating the ratio once. Watching how it behaves over several days can tell you more than reacting to a single 24-hour reading.
A temporary volume spike can come from an unusual market event, arbitrage, or a short-lived increase in demand. A pattern that persists is a different observation entirely.

This is where the difference between liquidity and utilization becomes especially important.
A liquidity provider does not earn swap fees simply because a pool has a large TVL.
Fees are connected to trading activity and the pool's fee configuration.
A simplified way to think about it is:
LP fee generation ≈ trading volume × LP fee rate
TVL is not the direct driver of the total fee generated by swaps.
Instead, TVL helps determine how much of the pool you represent.
That means two pools with similar TVL can still have very different fee-generation conditions if their trading volumes or fee parameters differ. STONfi also provides pool-level statistics including TVL, swap volume and APR, making these metrics available for comparison.
So when looking at a pool, the question should not simply be:
"How much money is inside?"
It should also be:
"What is that liquidity actually doing?"
APR can be useful, but it is not a promise of future returns.
STONfi describes pool APR as an estimate based on recent activity, meaning it can change as market conditions change.
Imagine a pool suddenly experiences a major increase in trading volume.
Its displayed APR may rise.
That number may be completely accurate based on the recent data while still failing to explain why the increase happened.
Was there a temporary market event?
Was there unusually high volatility?
Was there a short-lived incentive?
Did arbitrage activity temporarily increase?
Or is there genuine recurring demand?
There is another side to this as well.
If TVL falls while fee generation remains relatively stable, the displayed annualized return can rise because the amount of liquidity sharing those fees has decreased.
So a rising APR does not automatically mean the underlying opportunity has improved.
The useful question is not just:
"What is the APR?"
It is:
"What conditions produced this APR, and are they still present?"

Another reason simple TVL comparisons can be misleading is that not every pool is structured in the same way.
STONfi's current documentation identifies multiple pool designs, including Constant Product, StableSwap, Weighted StableSwap and Weighted Constant Product variants.
These designs can behave differently because they use liquidity and asset relationships differently.
A pool designed around closely related assets is not necessarily comparable to a volatile token pair simply because both display a TVL figure.
Weighted pools also introduce different weight parameters, meaning the exposure is not necessarily equivalent to a conventional equal-weight pool. STONfi's API exposes pool information such as reserves, weights, fee parameters and 24-hour volume.
So before comparing two pools, it is worth understanding what kind of pools they actually are.
Once you realize TVL is not enough, it can be tempting to go to the other extreme and simply look for the highest volume-to-TVL ratio.
That creates another problem.
High trading activity can sometimes occur during periods of intense volatility or heavy arbitrage. Those conditions can generate substantial swap volume and fees while simultaneously creating greater economic risk for liquidity providers.
The assets themselves therefore matter.
Ask:
How volatile are the two assets?
How closely are they expected to move together?
Could one asset lose its expected price relationship?
Would I be comfortable holding these assets separately?
An LP position is still exposure to the underlying assets.
A high TVL figure does not remove that exposure, and a high APR does not remove it either.
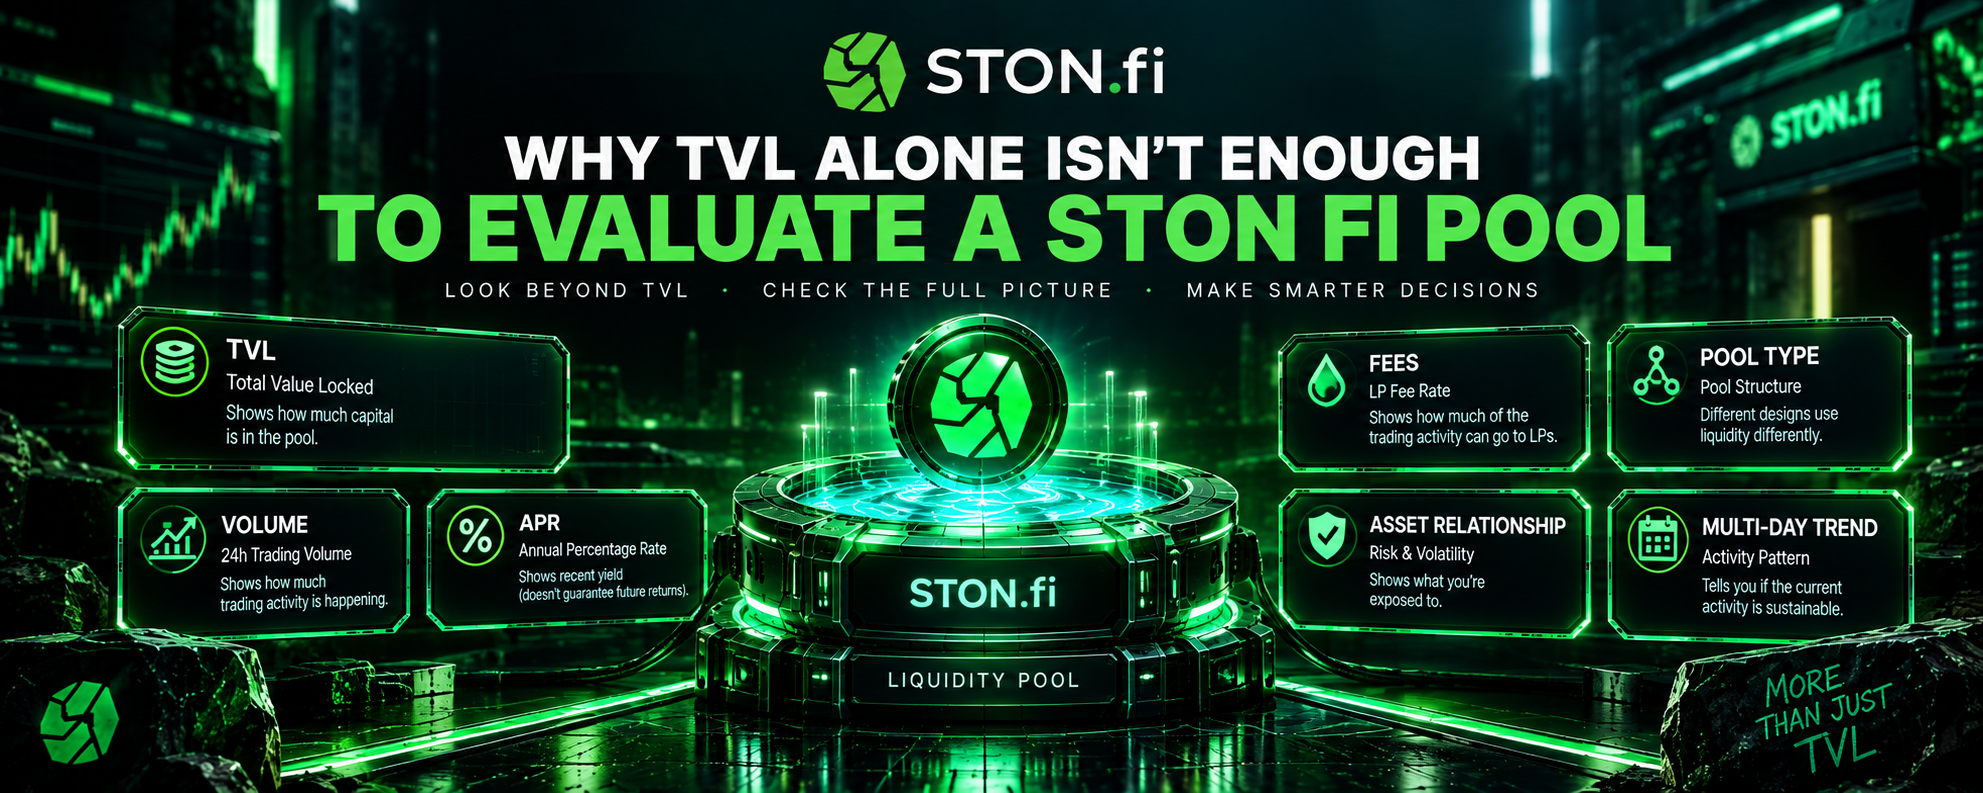
Instead of treating one metric as the answer, it makes more sense to view the major numbers as different pieces of the same picture.
TVL — How much liquidity is available?
24h Volume — How much trading is happening?
Volume / TVL — How actively is the liquidity being used?
LP Fee Rate — What portion of trading activity can accrue as fees?
APR — What do recent conditions look like when annualized?
Pool Type — How is the liquidity structured?
Asset Relationship — What kind of volatility and asset exposure does the position carry?
Multi-Day Trend — Does today's activity look persistent or unusual?
STONfi's pool interface is designed to expose several of these statistics together, including TVL, swap volume, APR, slippage and pool parameters.
The value comes from looking at them together rather than allowing one number to dominate the entire analysis.
Consider two hypothetical pools:
Pool X
TVL: $10M
24h volume: $150K
Volume / TVL: 1.5%
APR: 4%
Pool Y
TVL: $1M
24h volume: $600K
Volume / TVL: 60%
APR: 35%
At first glance, Pool Y has much more trading activity relative to its liquidity and a higher displayed APR.
But that still does not answer the important questions.
For Pool Y, you would want to understand why the volume is so high, whether the activity has persisted, what is driving the trades, and what risks come with the underlying assets.
For Pool X, you would want to understand why such a large liquidity base is generating comparatively little volume and whether the asset profile or other characteristics explain the difference.
The point is not to declare one pool the winner.
The point is to understand why the numbers look the way they do.
A simple process can help prevent one impressive-looking number from controlling the entire analysis:
TVL — How much liquidity exists?
Volume — How much trading is happening?
Volume / TVL — How actively is that liquidity being used?
Fees — What fee conditions apply?
APR — What do recent conditions imply?
Assets — What exposure does the pool contain?
Pool Design — What type of liquidity model is being used?
Trend — Does the current activity look normal or unusual?
None of these metrics gives the complete answer on its own.
Together, they provide considerably more context.
TVL is still useful.
It tells you something important about the amount of capital currently sitting inside a pool and can help you understand liquidity depth.
The mistake is treating that information as a complete assessment of the pool.
A large pool with little trading activity can have very different economics from a smaller pool with recurring volume. At the same time, high volume or a high APR can come with additional volatility and asset-specific risks.
Every metric answers a different question.
TVL tells you how much capital is present.
Volume tells you how much trading is taking place.
Fee parameters tell you how that activity can translate into LP fees.
APR summarizes recent conditions on an annualized basis.
Pool type tells you how the liquidity is structured.
And the underlying assets tell you what you are actually exposed to.
That is why TVL should be treated as a starting point, not the final assessment.
A pool with more liquidity is not automatically a better opportunity simply because the TVL number is larger.
Likewise, a smaller pool with higher volume or APR should not automatically be treated as superior.
The useful analysis begins when you stop asking which number is biggest and start asking what each number is actually telling you.
TVL shows the size of the liquidity base.
The other metrics explain what is happening around it.
That is the difference between simply reading a pool page and actually understanding it.
STONfi Pools: https://app.ston.fi/pools
STONfi Help Center, Evaluating Liquidity Pools: https://help.ston.fi/
STONfi Developer Documentation: https://docs.ston.fi/