BDAG Slips to $0.0000176 as the Presale Clock Runs BDAG fell to $0.00001760 on November 3, 2026, down 11.08% over the past day. The BlockDAG listing question remains open, since no exchange h
BDAG Slips to $0.0000176 as the Presale Clock Runs
BDAG fell to $0.00001760 on November 3, 2026, down 11.08% over the past day.
The BlockDAG listing question remains open, since no exchange has been named. This outlook reads the four hour chart and sets three November price zones.
What the Latest Project Post Says About Presale and Trading
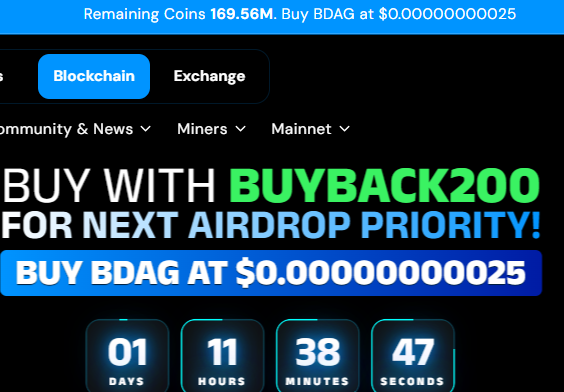
According to the project, on November 2, 2026, X post gives 48 final presale hours, with no extensions. It calls the current airdrop round complete and says exchange trading is being prepared. It names no exchange and gives no trading date.
Planned targets: $0.65 for NEW BDAG and $1.00 for BDAGUSD.
Website timer: 1 day, 11 hours and 38 minutes, which differs from the post’s 48 hours.
Remaining presale coins: 169.56M, with NEW BDAG at $0.00000000025.
Airdrop round: described by the project as complete.
Exchange status: teased, not confirmed.
Source: Official Website
Reading the BDAG Chart From Early October
Marked lines come from the chart, and other levels are read by eye, so all are approximate.
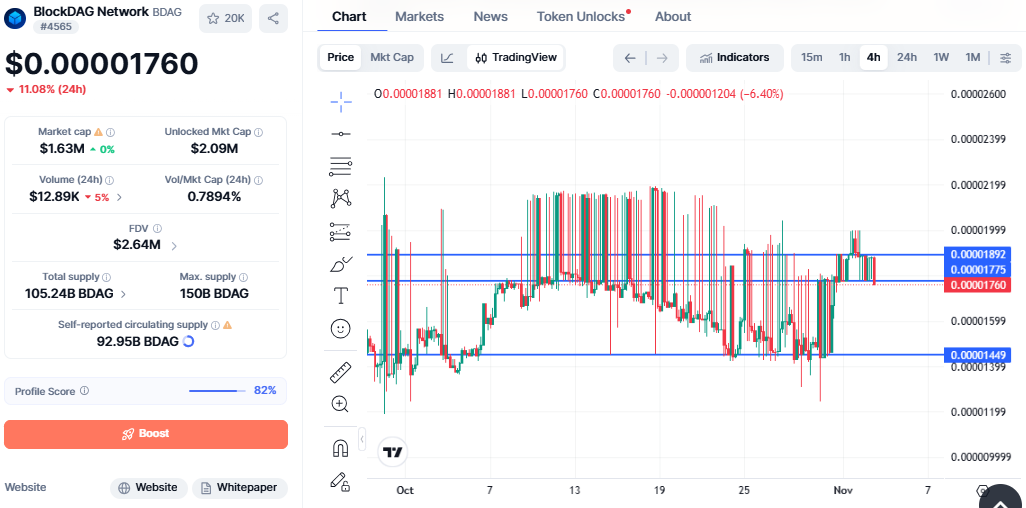
The four hour BlockDAG chart runs from early October to November 3, 2026. BDAG rose from near $0.0000120 to about $0.0000220 by mid October. The gap from the $0.0000120 low to that peak is about 83%.
The quote then slid into a band, with lows near $0.0000145 through late October. A long wick, the thin line showing a brief low near $0.0000120 around October 30, did not hold.
Early November brought a push to about $0.0000199. Sellers then pulled the quote back under the marked $0.00001892 line. The latest candle opened at $0.00001881 and fell to $0.00001760, down 6.40%.
The page shows -11.08% over 24 hours, while the latest candle shows -6.40%.
Level
Zone
What the chart shows
Resistance
$0.0000220
Mid-October peak
Resistance
$0.0000199
Early November high
Resistance
$0.00001892
Marked line, recent cap
Resistance
$0.00001775
Marked line just above quote
Support
$0.00001449
Marked line, recent lows
Support
$0.0000120
Brief wick low
Source: CoinMarketCap Chart
Note: Prices can change quickly, so figures may not reflect the latest value. Readers should check a live price tracker for current data.
BlockDAG Market Data Frames Any Listing Move
Metric
Value on November 3, 2026
Latest quote
$0.00001760
24-hour change
-11.08%
Market cap
$1.63M
Unlocked market cap
$2.09M
Fully diluted valuation (FDV)
$2.64M
24-hour volume
$12.89K
Volume to market cap ratio
0.7894%
Self-reported circulating supply
92.95B
Total supply
105.24B
Max supply
150B
Volume of $12.89K equals about 0.79% of market cap in 24 hours. That is thin, so small orders can move the quote sharply.
A BlockDAG listing could add venues and trading depth, though it would not guarantee demand.
The tracker lists max supply at 150B, about 61% above circulating supply. Trackers count supply differently, so figures vary between sites.
BlockDAG Price Prediction Zones for November 2026
Each zone starts from the $0.00001760 quote on November 3, 2026.
Scenario
Trigger
Zone
Move from quote
Bull
Daily close above $0.00001892 with rising volume
$0.0000199 to $0.0000220
+13% to +25%
Base
Quote stays between $0.00001449 and $0.00001892
$0.00001449 to $0.00001892
-18% to +8%
Bear
Daily close below $0.00001449
$0.0000120 to $0.0000135
-32% to -23%
The base case fits best, since the token held between $0.0000145 and $0.0000190 for two weeks. A bounce toward $0.00001892 would retest the marked line first. A drift toward the middle of the band would match that pattern.
A bull move needs a daily close above $0.00001892, a line that capped the latest push. More buying interest would be the key sign, since trading is thin. A confirmed BlockDAG launch date could support that case.
A bear move starts with a daily close below $0.00001449. The October 30 wick near $0.0000120 would then come into view. That level sits about 32% below the quote.
Four signals would shift these zones:
A named exchange and a trading date from the project.
Volume moving well above $12.89K.
A close outside the $0.00001449 to $0.00001892 band.
Any change to the presale timer or remaining coins.
These zones cover the rest of the month and need weekly review as new data arrives.
Expert Opinion on BDAG Range Risk and Liquidity
The chart shows a wide band with sharp wicks, which signals thin liquidity. Bands can break either way, so closes matter more than single spikes. Volume near $12.89K leaves little room for large orders.
A named exchange would give analysts firmer inputs than timers do. Until then, BlockDAG price prediction work rests on chart levels alone.
What Could Change the BDAG Outlook After the Presale
The token sits below the marked $0.00001775 line, with thin trading and no named exchange. Any BlockDAG launch now depends on dated project updates.
Readers can follow the project’sofficial X account for dated posts. A close beyond either marked line would test these zones.
YMYL Disclaimer:This article is for educational and informational purposes only. It does not offer financial advice, price guarantees, or return promises. Crypto assets are volatile, so readers should research independently before making decisions.