The XRP price is changing hands around $1.1095 at the time of writing, up close to 3.9% on the day. The move comes as traders weigh mixed signals from derivatives markets and ETF flow data. R
The XRP price is changing hands around $1.1095 at the time of writing, up close to 3.9% on the day. The move comes as traders weigh mixed signals from derivatives markets and ETF flow data.
Ripple has joined the x402 Foundation as a Premier Member. As AI agents start handling more of the payment process, they need a way to pay that works as fast as they already exchange data.
Ripple says it has been building that infrastructure on the XRP Ledger, including support for x402 that lets agents transact using XRP and RLUSD.
XRP has been trading inside a long weekly downtrend since its peak above $3.60 in July 2025. That falling channel is still intact on the charts, and this small bounce puts the coin right in the middle of the range.
What is the XRP price doing today?
The altcoin jumped from a weekly open near $1.086 to touch a high of $1.121 before settling back to $1.1083. Weekly trading volume came in at 168.93 million.
The 14-period RSI sits at 34.84, still below the neutral 50 mark. That suggests sellers still have some control, even with today's green candle.
The MACD line remains under its signal line, though the histogram has been shrinking in recent weeks. A cross above zero would be an early sign that momentum is shifting.
Is XRP futures data bullish or bearish right now?
XRP futures volume over the past 24 hours reached $2.08 billion, up 34.74% from the prior day. Open interest climbed 4.07% to $2.42 billion.
The long/short ratio across accounts stands at 1.0812, showing a slight lean toward long positions. On Binance, the XRP/USDT long/short account ratio is higher at 2.5958, and OKX shows a similar tilt at 2.77.
Liquidation data tells a rougher story for bulls. Over the past 24 hours, $2.69 million in positions were wiped out, and longs took the bigger hit at $680.86K compared to $2.01 million in short liquidations reversed against shorts over the same window.
In the last 12 hours alone, long liquidations totaled $440.13K.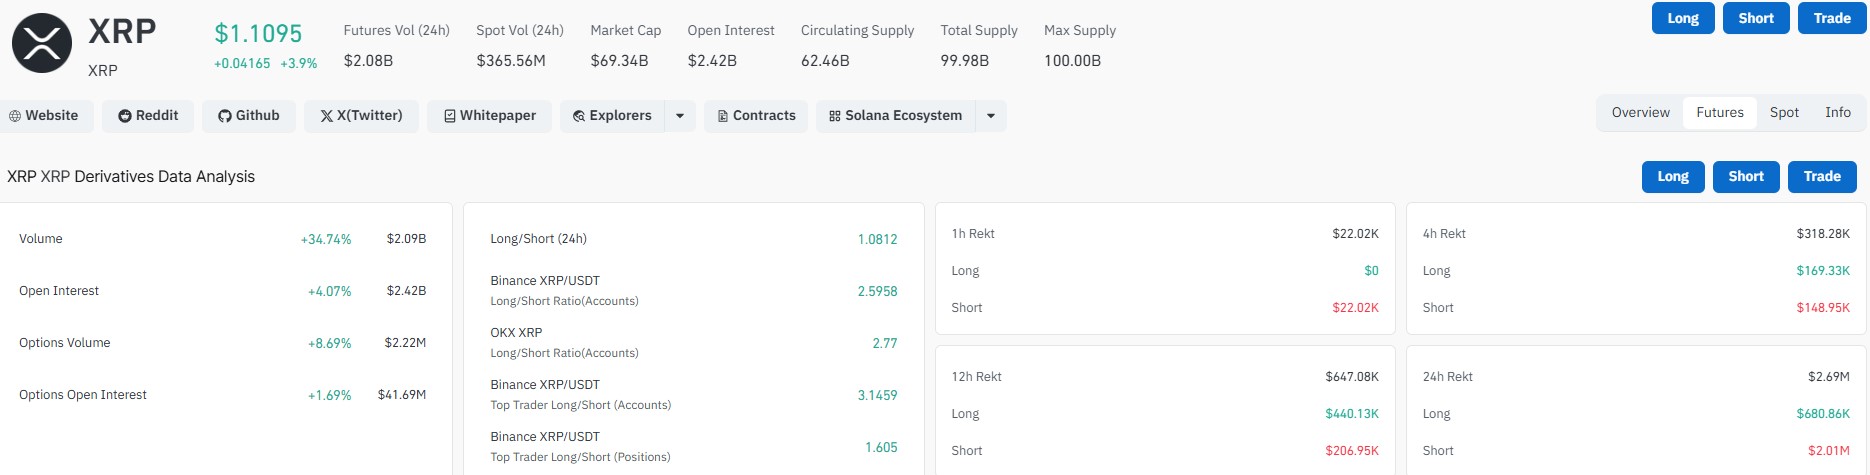
How are XRP ETF inflows trending this month?
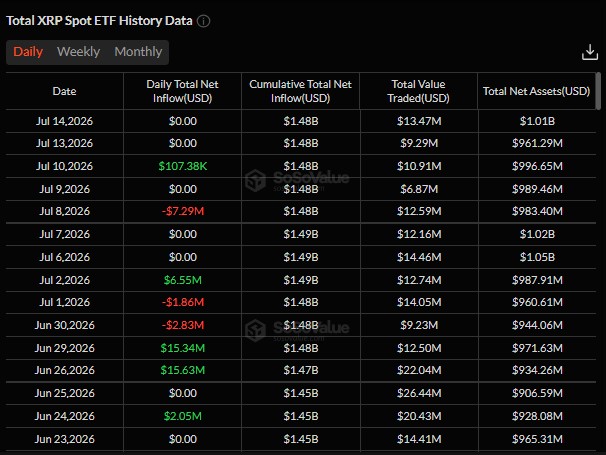
Spot XRP ETF data shows a quiet stretch for new money. On July 14, 2026, daily net inflow was flat at $0.00, matching several other sessions this month, including July 13, July 7, and June 30.
There have been a few bright spots. July 10 brought in $107.38K, and June 29 saw a stronger $15.34 million inflow. Cumulative total net inflow into XRP spot ETFs has held steady around $1.48 billion since late June.
Total net assets across these funds sit near $1.01 billion as of July 14, based on the most recent daily figures.
Date
Daily Net Inflow
Cumulative Inflow
Total Net Assets
Jul 14, 2026
$0.00
$1.48B
$1.01B
Jul 10, 2026
$107.38K
$1.48B
$996.65M
Jul 8, 2026
-$7.29M
$1.48B
$983.40M
Jun 29, 2026
$15.34M
$1.48B
$971.63M
Jun 26, 2026
$15.63M
$1.47B
$934.26M
What are the key support and resistance levels for $XRP?
On the daily chart, the altcoin is trading right at the lower edge of a descending channel that started forming after the July 2025 top near $3.65.
Price is now testing that lower trendline directly, with the current candle sitting between $1.0990 and $1.1139.
This lower boundary lines up closely with the $1.00 to $1.10 zone. A daily close below this trendline would signal a breakdown, while a bounce here would keep the channel structure intact.
The upper trendline of the channel has been sloping down for months and now sits much lower than it did last year, currently tracking somewhere near the $1.30 to $1.40 area.
That's a big drop from the $2.40 region the same trendline marked back in January 2026.
Below current price, the psychological $1.00 level remains the key line traders are watching. The altcoin has wicked below that mark multiple times since June without a daily close under it.
RSI sits at 47.28, just under the neutral 50 line, showing the momentum is flat rather than strongly bearish or bullish. MACD remains slightly negative at -0.0128, though the histogram has been narrowing.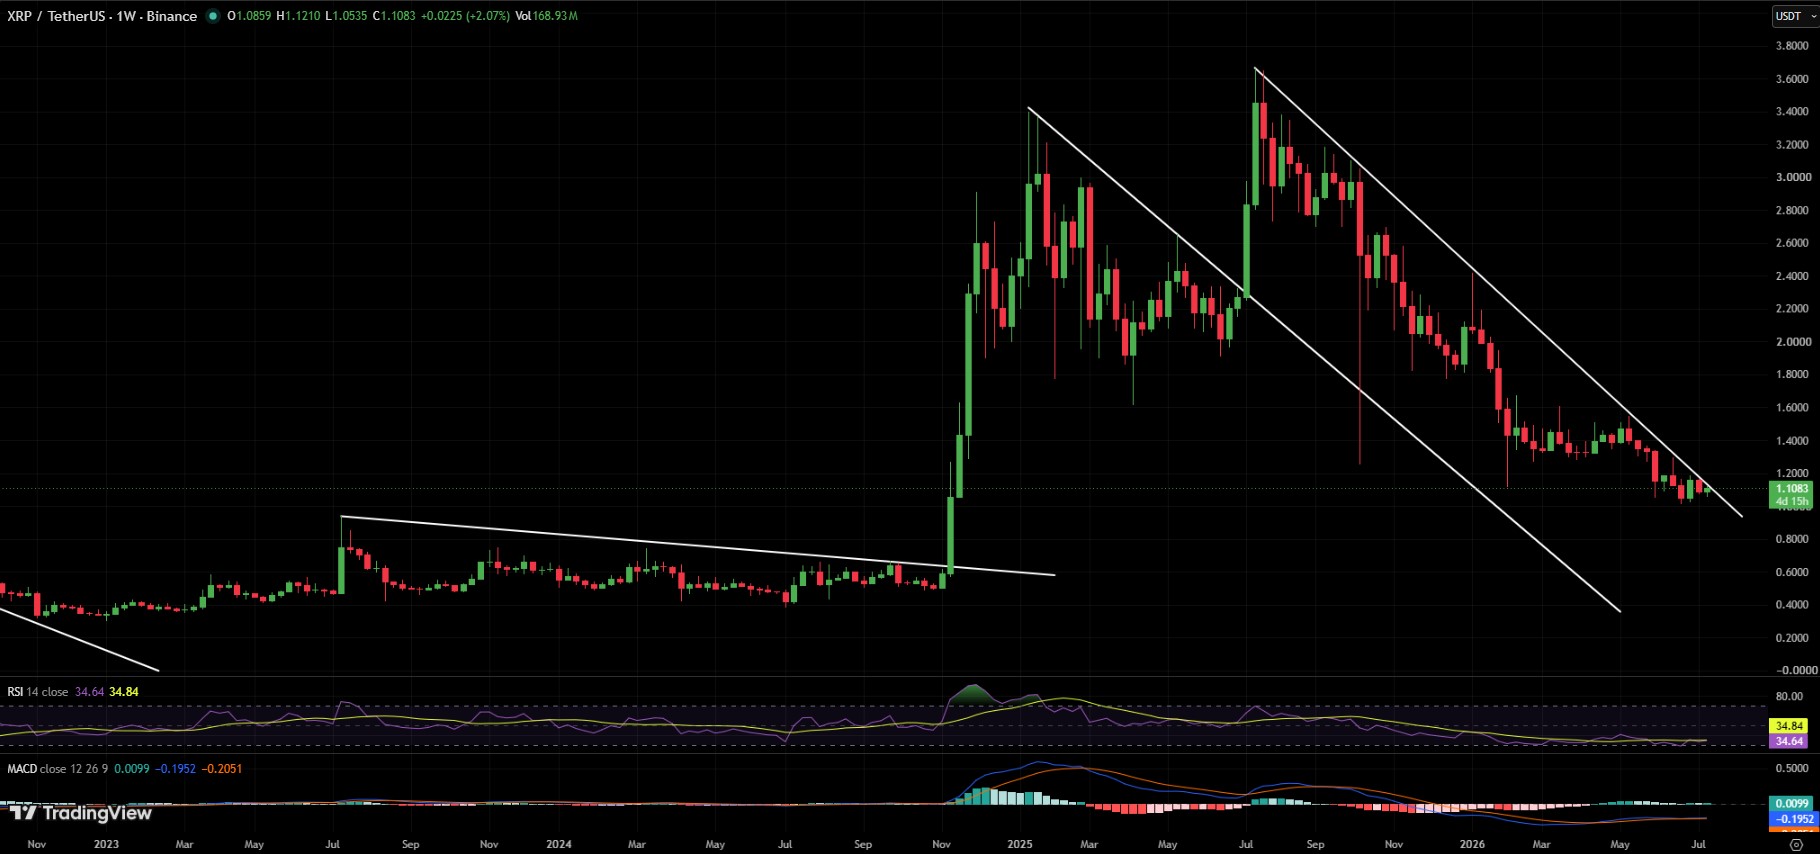
Where could $XRP price go next?
With RSI still under 50 and MACD below its signal line, the weekly trend structure leans cautious for now. That said, futures open interest and volume are both rising, which often points to bigger moves ahead in either direction.
A push through the falling trendline resistance, combined with a pickup in ETF inflows, could open the door toward the $1.40 to $1.50 zone. On the downside, a failure to hold above $1.00 could send the altcoin back toward levels last seen in early 2025.
Nothing here is fixed. Crypto markets move fast, and today's setup can shift within days.
Disclaimer
This article is for informational purposes only and does not constitute financial, investment, or trading advice. Cryptocurrency markets are highly volatile and unpredictable. Past performance is not indicative of future results. Always conduct your own research and consult a licensed financial advisor before making any investment decisions.
