World Liberty Financial is buzzing right now, and WLFI holders are paying close attention. $WLFI just bounced hard after days of selling, and the token is back in the spotlight with fresh new
World Liberty Financial is buzzing right now, and WLFI holders are paying close attention.
$WLFI just bounced hard after days of selling, and the token is back in the spotlight with fresh news doing the rounds too. Price is holding above $0.05 after the move.
This World Liberty Financial Price Prediction breaks down the latest $WLFI news, where price could head next, and the levels that could decide the next big move.
World Liberty Financial is a crypto project, according to the project's own materials. Stick around till the end, because there's a lot moving on WLFI right now.
Market data checked on August 10, 2026. 13:49 UTC+5:30
World Liberty Financial Price Prediction Today: Market Overview
Metric
Value
Price
$0.052908
24h Change
+1.97%
Market Cap
$1.68B (+1.97%)
Volume (24h)
$40.15M (+50.29%)
Vol/Mkt Cap (24h)
2.44%
FDV
$5.28B
Liq/Mkt Cap
1.57%
Total Supply
100B WLFI
Max Supply
100B $WLFI
Circulating Supply
31.77B $WLFI
Holders
148.94K
Source: Data from CoinMarketCap as of August 10, 2026. 13:49 UTC+5:30. Figures may vary slightly across other tracking websites.
$WLFI News: Aqua 1 Buyer Reportedly Arrested in the UK
Source: Data from Blockchain Daily News
A post shared by Blockchain Daily News cites a report from The Block, saying Aqua 1's $100M WLFI buyer, identified as "Bobby" Zhou, was arrested in the UK back in 2021 over money laundering suspicion, and that the probe is still active.
The same post claims $75M was reportedly sent to a Trump-linked entity.
This is a reported allegation tied to an active investigation, not a confirmed legal outcome, so it's worth treating as developing news rather than a settled fact.
$WLFI News: Reward Campaign Extended to September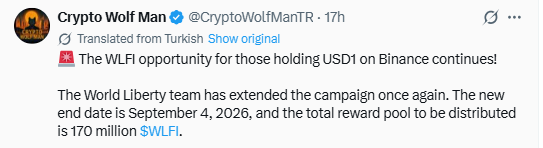
Source: Data From X
A post from Crypto Wolf Man says the WLFI rewards campaign for USD1 holders on Binance has been extended again.
The new end date is September 4, 2026, and the total reward pool being handed out is 170 million WLFI. This gives USD1 holders on Binance more time to qualify for the rewards.
World Liberty Financial Price Prediction Chart: Technical Analysis
Pair: $WLFI/USDT · Timeframe: 4H · Source: TradingView · Timestamp: August 10, 2026, 13:49 UTC+5:30
$WLFI is trading at $0.052908, Price had been sliding lower inside a falling channel since early August, dropping from a local top near $0.056 down toward $0.050608, before a sharp green candle broke price back above the top of that channel.
The price is now consolidating just above the breakout point.
RSI (14) is at 54.69, sitting in the middle of its range, showing the bounce hasn't stretched into overbought territory.
The trend stays bullish as long as price holds above the $0.052503 support and stays above the EMA near $0.052405.
If price trades back below that support and breaks the EMA zone, we can assume a bearish trend until the trend turns bullish again.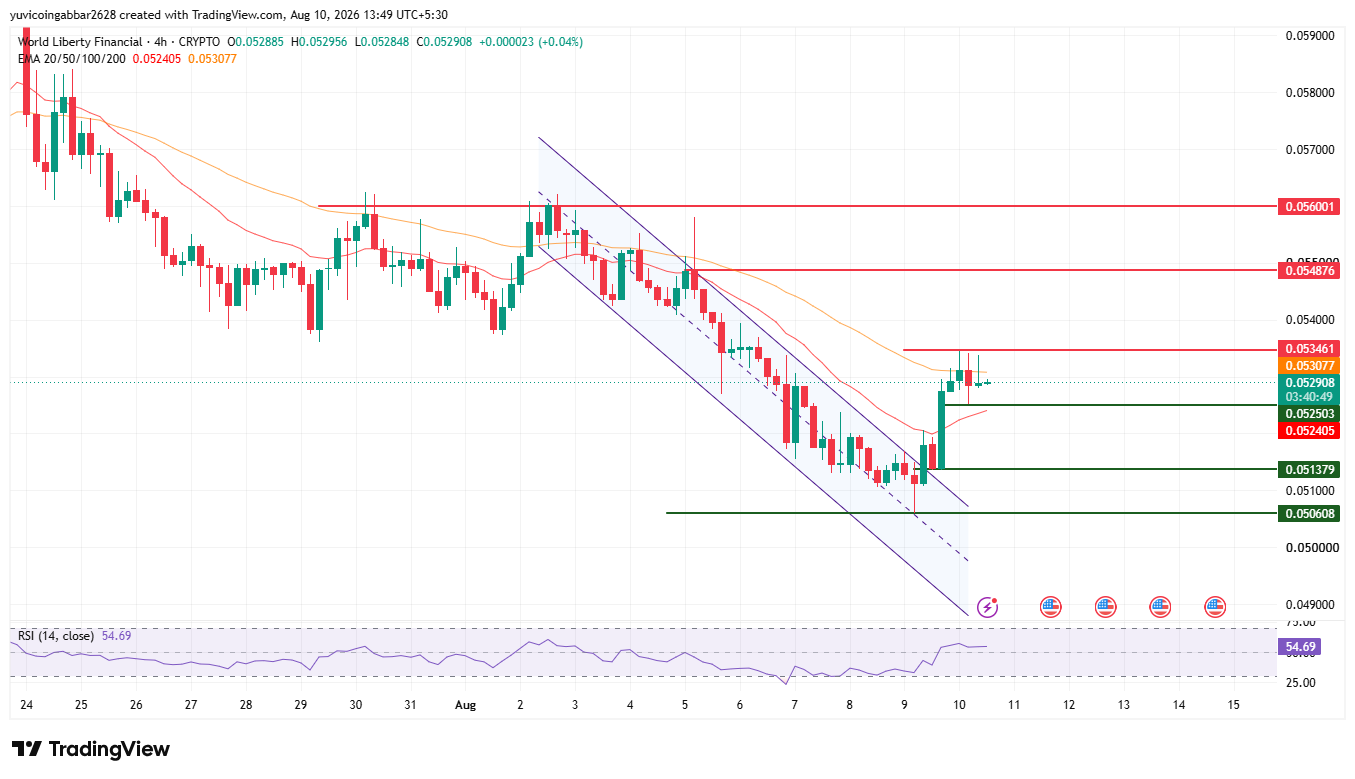
Support and Resistance Levels
Level Type
Price
Resistance 3
$0.056001
Resistance 2
$0.054876
Resistance 1 (nearest)
$0.053461
Immediate Price Reference
$0.052908
Nearest Support
$0.052503
Deeper Support
$0.051379
Structural Floor
$0.050608
EMA Levels
EMA
Price
EMA 20 (near support)
$0.052405
EMA 50 (near resistance)
$0.053077
World Liberty Financial Forecast: Bull Case vs. Bear Case
$WLFI price target 2026 Bull case: Holding above $0.052503 and clearing the EMA cluster near $0.052405 to $0.053077 keeps the channel breakout intact.
A confirmed move above $0.053461 would open the path toward $0.054876 and then $0.056001.
$WLFI price target 2026 Bear case: A close back below $0.052503 would put the breakout in doubt and could send price back toward the channel.
Losing $0.051379 would expose the structural floor at $0.050608.
$WLFI price target: Can WLFI Reach $0.056001?
$0.056001 is the highest resistance marked on the chart. Getting there would take a multi-stage move: first clearing $0.053461, then $0.054876, before price could realistically test that higher level.
What Could Invalidate the Bullish Setup?
A rejection at $0.053461 followed by a close back below $0.052503 would put the breakout in question.
A deeper break below $0.051379 and the structural floor at $0.050608 would undo the bounce entirely.
World Liberty Financial Price Prediction: Expert View
According to CoinGabbar analysts, the break above the falling channel is the key technical development here, and it comes right as fresh news around WLFI is circulating.
RSI at 54.69 shows the bounce has room before it gets overbought, which leaves space for further upside if buyers stay in control.
The extended rewards campaign could keep some demand active on the USD1 side through early September, while the Aqua 1 buyer story is a legal and reputational overhang worth watching since it involves an active investigation.
The $0.052503 to $0.053461 zone is the range to watch: holding above it keeps the breakout thesis alive, while losing it would suggest the bounce is fading.
World Liberty Financial Price Prediction: Data Sources
Price, market cap, and supply data referenced from a market tracker snapshot.
News references from posts by Blockchain Daily News and Crypto Wolf Man on X, citing a report from The Block.
Price and EMA data referenced from a 4H WLFI/USDT chart via TradingView, timestamped August 10, 2026, 13:49 UTC+5:30.
Disclaimer
This piece is for informational purposes only and isn't financial advice. The levels and scenarios above are based on technical chart analysis and publicly available data at the time of writing, and crypto markets can move sharply within hours, so past patterns don't guarantee future outcomes. The news items referenced above are based on third-party social media posts and reports and should be independently verified. It's worth doing independent research and considering your own risk tolerance before acting on any of the levels discussed here.