The latest XDC Network price prediction is rising as XDC extends a steady climb. The token is up 2.2% over the last 24 hours and has gained roughly 16% from its recent low. Traders want to kn
The latest XDC Network price prediction is rising as XDC extends a steady climb.
The token is up 2.2% over the last 24 hours and has gained roughly 16% from its recent low. Traders want to know whether the move can continue. $XDC now trades near $0.03067.
XDC Network, formerly known as XinFin, is an enterprise-focused blockchain with a focus on trade finance.
According to CoinGecko,XDC Network price today is $0.03067, within a 24-hour range of $0.02965 to $0.03129. XDC ranks 91st by market capitalization at about $607.2 million.
Live XDC Network Market Data
Metric
Value
XDC Price
$0.03067
24h Change
+2.2%
24h Range
$0.02965 to $0.03129
Market Cap
$607.215M
Market Rank
#91
Source: CoinGecko, as of November 18, 2026.
XDC Network Technical Analysis
This XDC Network price prediction for November 18 reads the hourly XDC chart on TradingView.
The price bottomed near $0.0270 and has since climbed inside an ascending channel. The gain to a high near $0.0313 is about 16%, and both channel lines slope up.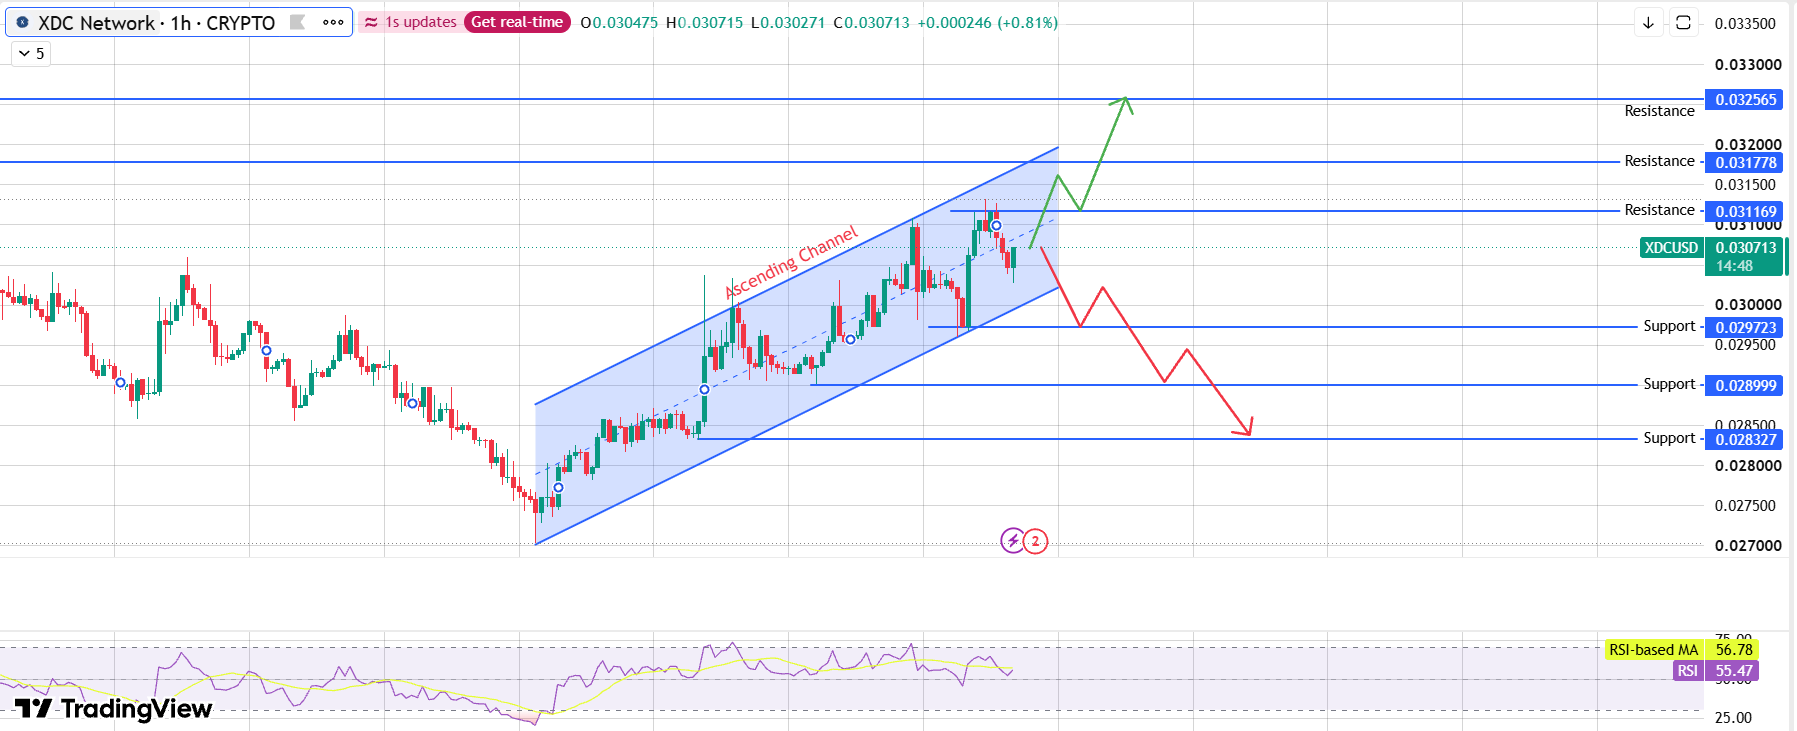
Source: TradingView, XDC Network 1H, as of November 18, 2026.
The upper line now runs near $0.0317 and the lower one near $0.0299, so the price sits in the middle.
A dip to $0.029723 touched the lower line and was bought up quickly. Price then pulled back from the $0.0313 high and is trying to bounce.
The latest candle opened at $0.030475, ranged from $0.030271 to $0.030715, and traded near $0.030713, a gain of 0.81%.
The RSI reads 55.47 against its average of 56.78, which shows neutral momentum cooling from earlier highs.
Can $XDC Bounce and Break the Resistance?
The bullish case starts with a hold. XDC needs to keep $0.029723 and the lower channel line, near $0.0299, intact, since that zone stopped the last dip.
The next step is an hourly close above $0.031169 with volume over the 20-period average.
That level sits near the recent high, so sellers have already shown up there once. A close on thin volume would carry little weight.
After that, the upper channel line near $0.0317 and $0.031778 forms the next test. A confirmed break would open $0.032565, about 6% above today's price.
What Happens If $XDC Loses Support?
The bearish case begins with a rejection at $0.031169 or the upper channel line. In that case, price would likely slide back toward $0.029723, the first support.
An hourly close below it and the lower channel line, on selling volume, would break the channel.
The next supports are $0.028999 and $0.028327, which sits about 8% under today's price.
A brief wick under support is not enough. If price closes back above $0.029723 within a few hours, the move may prove a false break.
Price Levels to Watch
Support
Resistance
$0.029723
$0.031169
$0.028999
$0.031778
$0.028327
$0.032565
Bull, Base, and Bear Scenarios for XDC Network Price Prediction
Scenario
Setup
Level
Bull
XDC holds $0.029723, then an hourly candle finishes above $0.031169 and later above the upper channel line.
$0.031778 first, then $0.032565
Base
XDC keeps climbing and dipping inside the channel, with no hourly close beyond $0.029723 or $0.031169.
Between $0.029723 and $0.031169
Bear
Support at $0.029723 gives way, and an hourly candle settles under it and the lower channel line.
$0.028999 first, then $0.028327
XDC Network vs Bitcoin
Any XDC Network price prediction outlook should check how $XDC trades against Bitcoin.
Over the last 24 hours, $XDC is up 2.2% in dollars and up 1.9% against Bitcoin.
Together, those figures imply that Bitcoin gained about 0.3% in dollar terms. $XDC therefore beat Bitcoin. The gain is mostly specific to the token.
Methodology
This XDC Network price prediction forecast draws on two inputs. Market data comes from CoinGecko and was taken on November 18, 2026.
The chart is an hourly XDC view from TradingView. Its exchange feed and time zone are not shown, so candle close times are not stated. No news item was included in this review.
Support and resistance levels were read directly from the chart. The channel lines carry no labels, so the $0.0317 and $0.0299 readings and the $0.0270 low are approximate.
The latest candle was still open at the time of the screenshot. CoinGecko's price differs slightly from the chart's last print because of timing.
Trading volume, liquidation data, and exchange flows were not part of this review, and the scenarios carry no assigned probabilities.
Expert Opinion
As general market commentary, a steady climb inside a channel often pauses near the upper line, where sellers who bought lower take profit.
The 16% gain from the low makes a pullback toward the middle or lower line a normal outcome.
A pullback that holds $0.029723 keeps the pattern intact. In the short term, that level and the volume on any move toward $0.031169 will show which side controls the channel.
Disclaimer: This article is for information only and is not financial advice. XDC is volatile, and the price can fall below $0.028327 if support fails and broader market conditions weaken. Hourly breakouts reverse often. No scenario here carries a stated probability, and a confirmed breakout can still fail. Readers should do their own research and size any position to a loss they can accept.