XLM rebounds from $0.15 as rising volume supports momentum, while resistance near $0.20 now controls the next move for buyers ahead. A nested 1-2 count remains favored because wave two lasted
- XLM rebounds from $0.15 as rising volume supports momentum, while resistance near $0.20 now controls the next move for buyers ahead.
- A nested 1-2 count remains favored because wave two lasted longer, while a conventional 3-4 structure appears less orderly here overall.
- RSI reaches 65.44 as MACD turns positive, leaving buyers with stronger momentum before resistance around 0.20-0.21 becomes the next test.
XLM has rebounded sharply from $0.15, bringing a long corrective structure back into focus. Price now approaches $0.20 resistance, while momentum indicators have turned firmly higher.
Buyers regain control near critical resistance
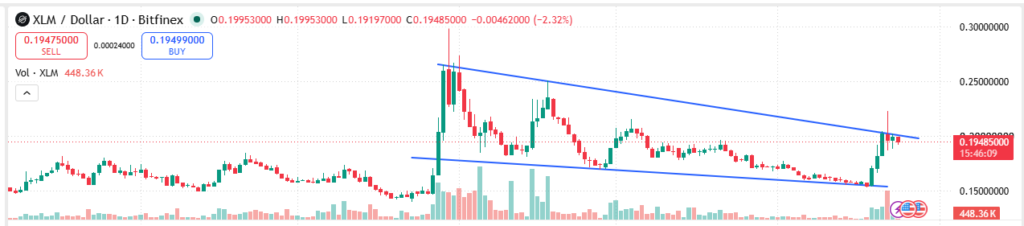
The daily chart shows a prolonged decline inside a descending channel. Price repeatedly respected the channel boundaries throughout July and August. The lower boundary eventually attracted buyers near the $0.15 region.
Source:
TradingviewThe rebound from that area developed alongside a sharp increase in trading volume. That combination separated the latest move from the preceding low-volume decline. Price subsequently returned toward the channel's upper boundary near $0.20.
The chart currently places price around $0.195, directly beneath resistance. Therefore, 0.20-0.21 represents the immediate technical hurdle. A daily close above that zone would challenge the established descending structure.
The broader setup also reflects a long period of overlapping corrective movements. Those movements gradually carried price toward the rising structural trendline. That trendline remains relevant while the larger bullish interpretation stays intact.
Nested wave count reshapes the broader structure
Nology recently revisited the chart and described the structure as a nested 1-2. The interpretation centers on the unusually long duration of wave two. A conventional 3-4 sequence appears less orderly within the displayed subdivisions.
https://twitter.com/nology3000/status/2091668286610219015?s=20
The earlier advance carried price toward the 0.40-50 region. That move was followed by several corrective swings across an extended period. The overlapping behavior makes a simple impulsive sequence harder to maintain.

Under the nested interpretation, smaller waves can develop inside larger corrective structures. This allows the prolonged wave-two duration to fit the broader count. The structure therefore remains open to another developing impulse.
The 0.14-0.15area remains the key structural defense. That region aligns closely with the rising trendline visible beneath price. Holding there preserves the proposed bullish count while the market develops.
RSI and MACD confirm improving short-term momentum
RSI has climbed to 65.44 after spending much longer near weaker levels. The sharp increase reflects the speed of the recent recovery. However, the indicator now approaches the upper portion of its recent range.
Source:
TradingviewMACD has also shifted after an extended period of negative momentum. The histogram has turned positive, while the MACD line moved above its signal line. Together, these readings show improving short-term momentum.
The latest volume expansion adds another layer to the current setup. Participation increased sharply during the rebound from the $0.15 area. Earlier consolidation, by contrast, developed with considerably lighter volume.
A breakout above 0.20-0.21 would place 0.23-0.25 into focus. Outside the above zone, some resistance is found around 0.26-0.28. In the case of a failure at the ceiling price may move back towards $0.18, and then 0.16-0.15 support.