Stellar Lumens (XLM) made waves this past week by posting a dramatic rally, drawing renewed interest from crypto investors. Yet by week’s end, the market saw a sharp correction and XLM plunge
Stellar Lumens (XLM) made waves this past week by posting a dramatic rally, drawing renewed interest from crypto investors. Yet by week’s end, the market saw a sharp correction and XLM plunged by 17 percent in the last 24 hours. This volatility has put the spotlight on key support and resistance levels as traders reassess their strategies.
Surge followed by sharp pullback
Over the last week, XLM surged by a total of 62 percent, benefitting from rising trading volumes, renewed investor attention, and excitement over a high-profile partnership with a major financial institution. The price reached approximately $0.206 at its peak, with trading activity intensifying especially during upward swings.
The surprise partnership announcement propelled Stellar’s price by more than 26 percent, boosting both trading volume and market capitalization. This move captured investor interest and sparked expectations of further breakouts at resistance levels.
However, this rally was quickly followed by a pullback. At the time of reporting, XLM was down around 17 percent on the day, making it one of the weakest among leading cryptocurrencies. Despite this retreat, the cryptocurrency maintained a strong 62 percent gain over the past week, with its price now hovering near key support levels.
Key support and resistance levels in focus
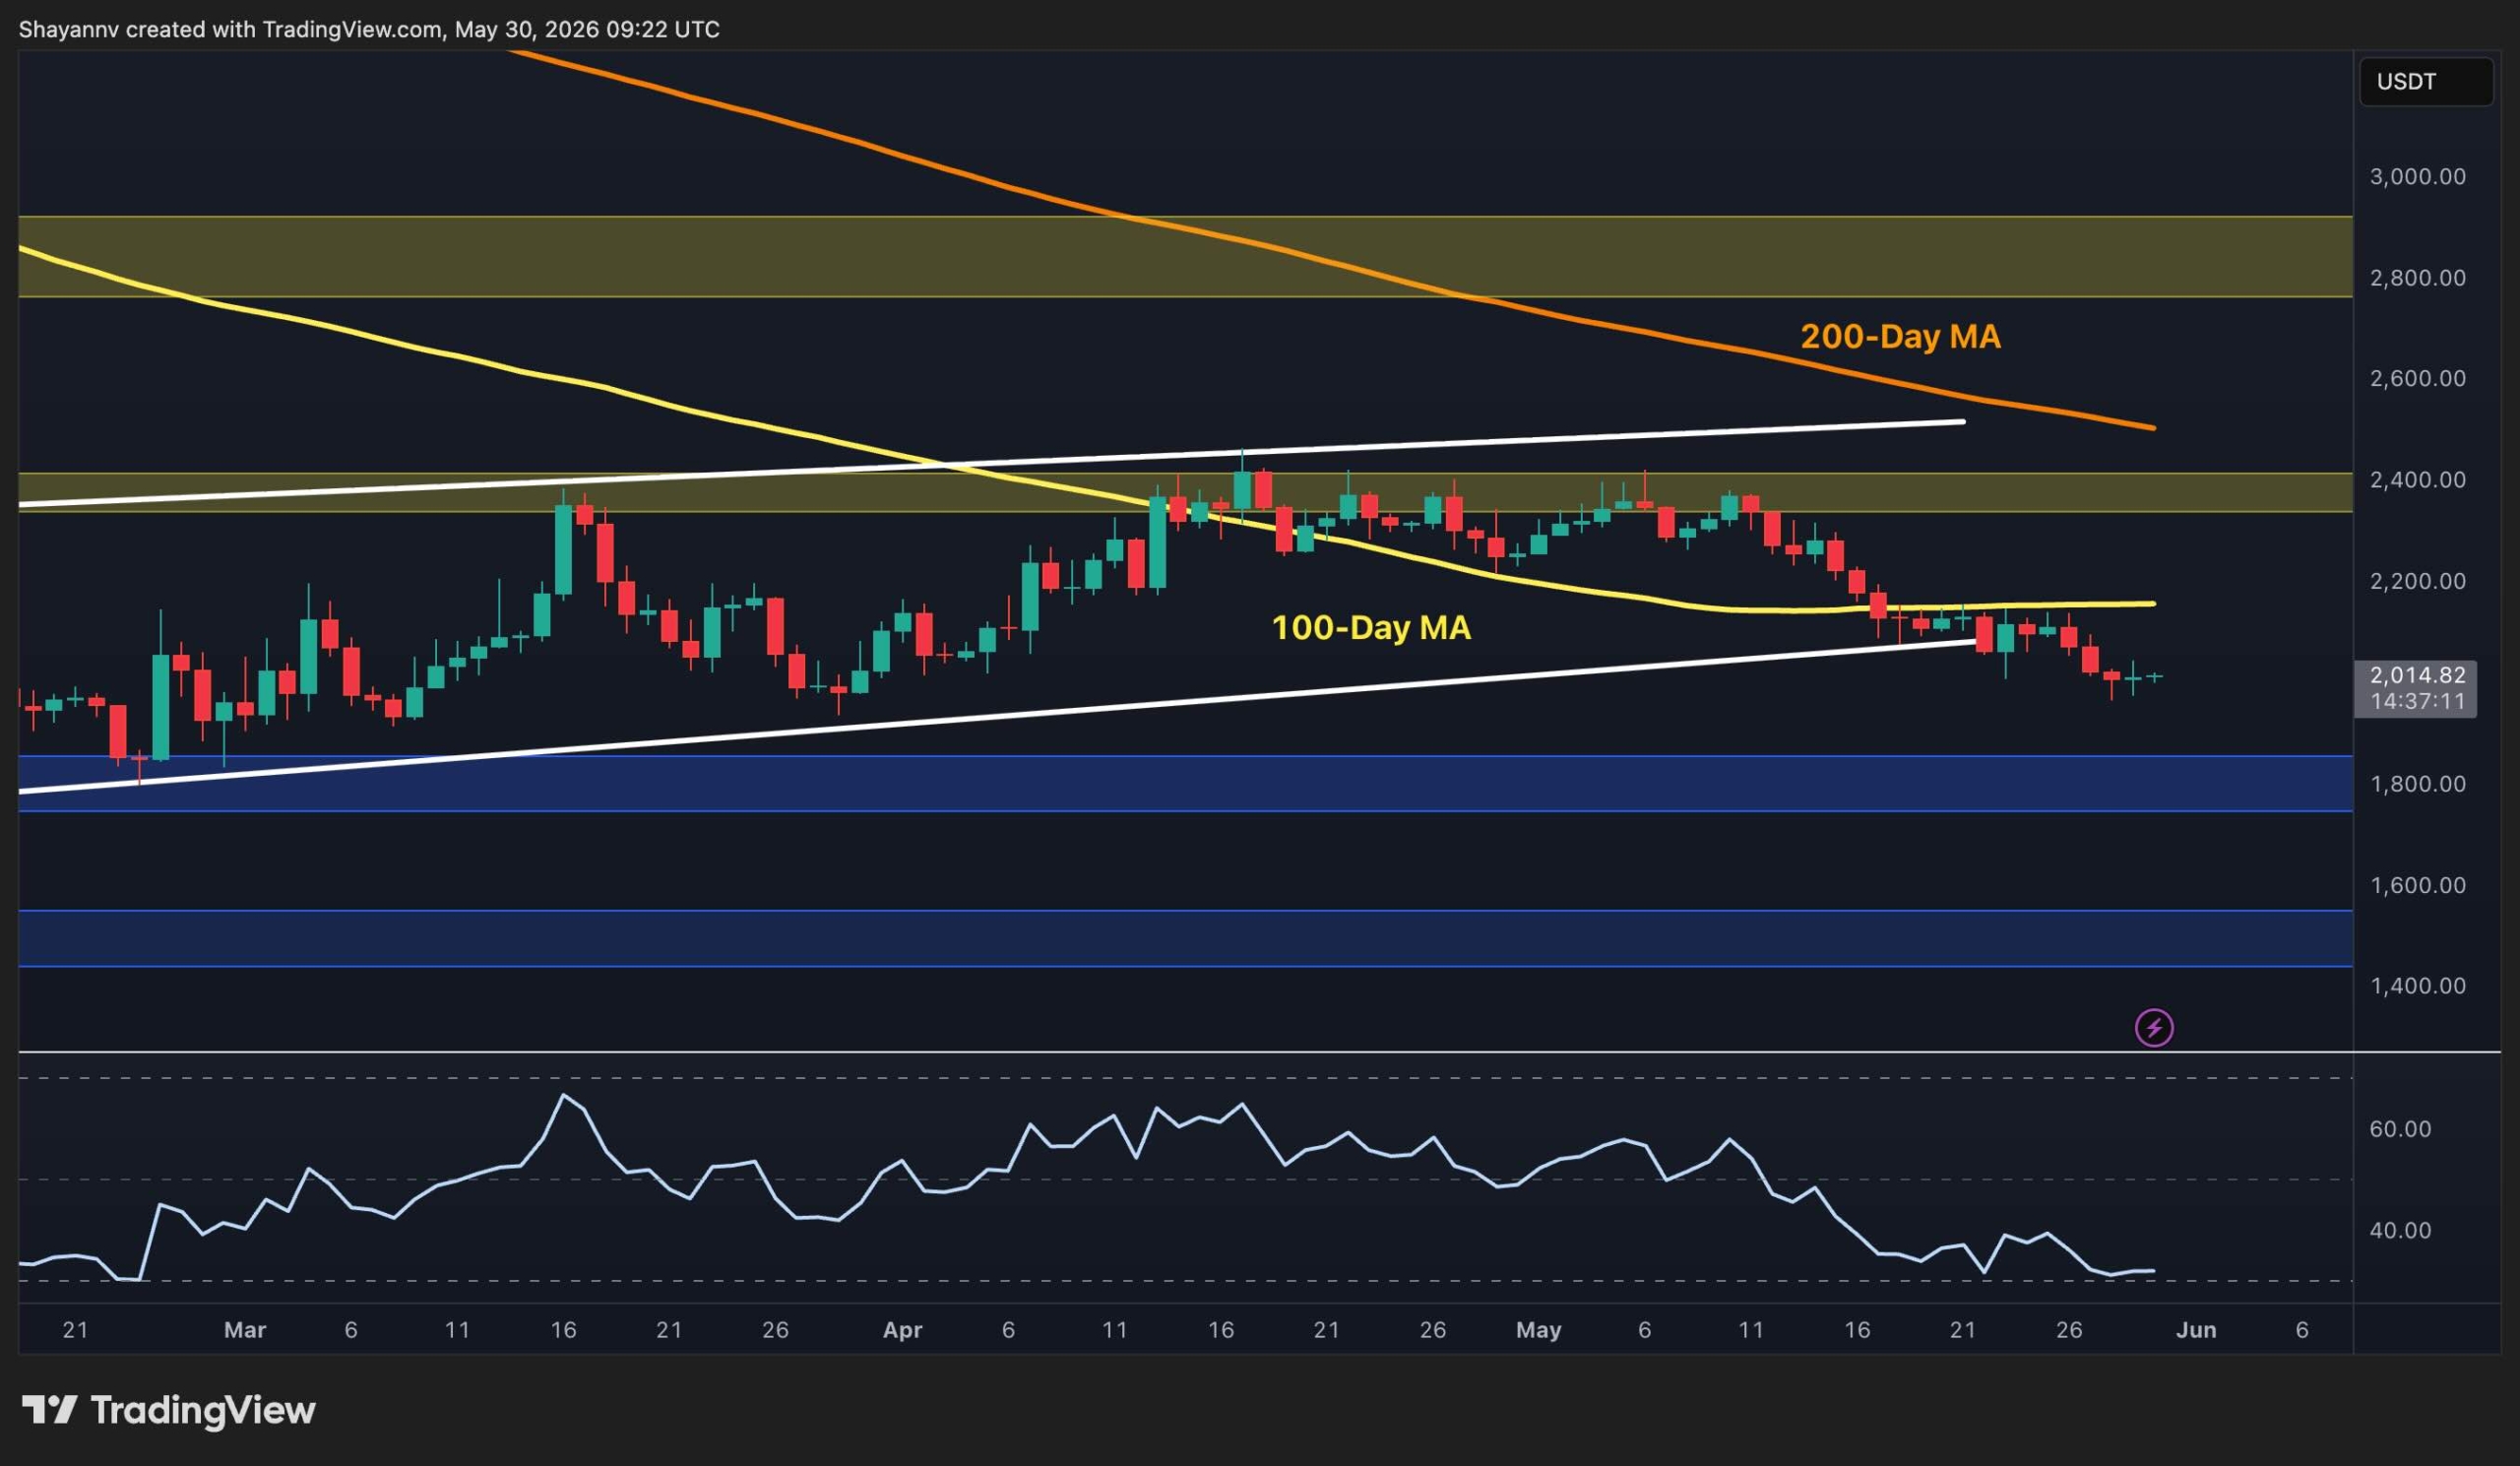
With the correction, crucial price levels have come into play for XLM. On the daily chart, the asset was recently trading at about $0.2366, marking a slight uptick of just over 3 percent. The first major support level stands at $0.2263, and analysts believe holding above this point will be essential for any short-term upward move.
If XLM closes below $0.2263, there is a risk of decline toward $0.20. In a deeper slide, the $0.15 to $0.17 range provides longer-term support. Conversely, on any upward momentum, the next major resistance is at $0.2730. If XLM breaches this line, targets shift to $0.3057 and then $0.3385.
Support LevelResistance Level$0.2263$0.2730$0.20$0.3057$0.15–0.17$0.3385
Technical indicators signal caution
Attention is now on technical indicators, particularly MACD and RSI. On the daily chart, the MACD signal recently shifted positive, with the MACD line crossing above its signal line and the histogram staying above zero—both suggesting upward momentum. Meanwhile, XLM’s RSI soared to 71.33, signaling that the coin entered the overbought range. This may indicate that the rally is losing steam and could lead to false breakouts or sideways price action.
Mini glossary: MACD (Moving Average Convergence Divergence) and RSI (Relative Strength Index) are widely used tools for crypto analysis. MACD measures the convergence and divergence of moving averages to identify trend changes, while RSI provides a value from 0 to 100 indicating whether an asset is overbought or oversold—values above 70 are considered overbought, and below 30 oversold.
The direction of XLM in the near term will largely depend on the broader market mood and how the price interacts with these technical levels. The $0.226 support and $0.273 resistance in particular are under close watch by market participants.
The post XLM jumps 62 percent then drops 17 percent in 24 hours appeared first on COINTURK NEWS.