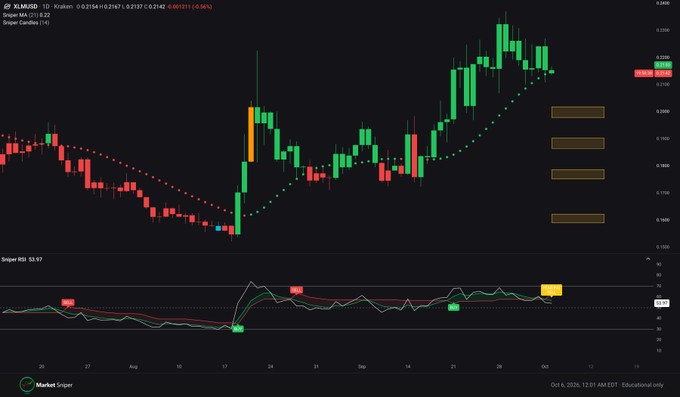
The XLM momentum has been fading with the RSI moving into a sell signal and price dropping below the Parabolic SAR trend dots. Derivatives activity is high and open interest is spread across
- The XLM momentum has been fading with the RSI moving into a sell signal and price dropping below the Parabolic SAR trend dots.
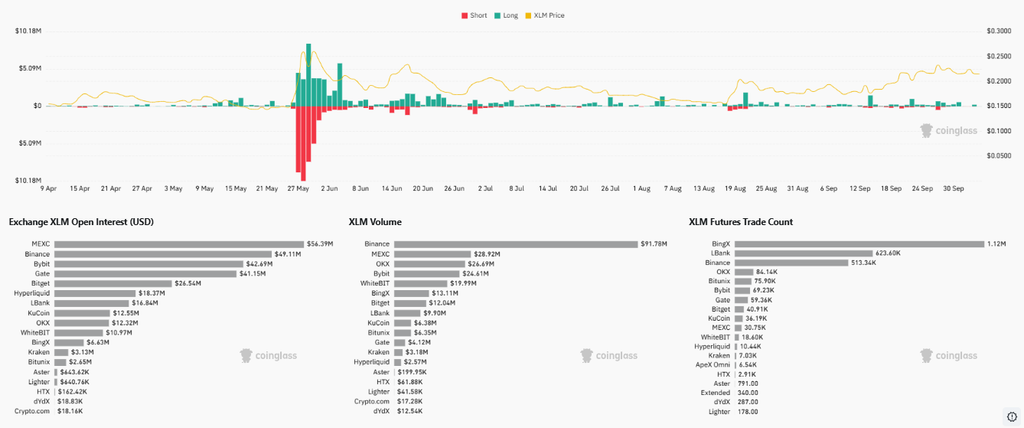
- Derivatives activity is high and open interest is spread across venues, while liquidation activity has caused volatility recently.
- The chart displays $0.20 as the initial downside zone, followed by $0.19, $0.175 and $0.16 in case the weakness continues.
XLM is showing early signs of fading momentum after its September rally, with RSI weakness and a Parabolic SAR shift now framing near-term conditions.
RSI and Parabolic SAR Signal Fading Momentum
Market Sniper Pro flagged two technical changes on the daily chart. The post points to a pending RSI sell signal. It also notes price moving beneath the trending dots.
Source:
X
The RSI strengthened sharply during September's advance toward the $0.23 region. Since then, momentum has flattened around elevated levels. That shift suggests the previous acceleration has started losing force.
The Parabolic SAR also changed during the latest price movement. Green dots previously remained below price during September's advance. The recent shift places the indicator above price again.
Current market data places XLM near $0.215. CoinGecko shows a 24-hour range between $0.2110-$0.2257. The latest reading confirms continued consolidation after September's stronger move.
Recovery Structure Meets Important Price Zones
The broader recovery began from the May 23 low near $0.15. A stronger advance emerged around August 18. That move pushed the price toward the $0.20 region.
The September rally extended that recovery and carried the price above $0.20. The price later reached approximately $0.23. Several advancing candles supported the stronger short-term structure.
However, the latest movement shows a retreat from those September highs. The asset has moved back toward the $0.21 area. This places the earlier breakout zone back under technical attention.

The chart marks four downside zones following the broader recovery. The first sits near $0.20. Additional zones appear around $0.19, $0.175, and $0.16.
Derivatives Activity Keeps Volatility in Focus
The liquidation chart shows the largest event around May 27 and May 28. Both long and short liquidations surged during that period. Price simultaneously moved sharply from roughly $0.15 toward $0.25.
Source:
Coinglass
Liquidation activity became smaller after that major reset. However, occasional clusters were observed in June, August and September. The changes in pricing and repositioning coincided with those episodes.
Open interest remains distributed across several derivatives venues. MEXC led the supply breakdown near $56.39 million. Binance and Bybit followed with approximately $49.11 million and $42.69 million.
Trading volume showed another distribution pattern across venues. Binance recorded approximately $91.78 million in volume. CoinGlass currently reports about $250.68 million in futures volume and $297.90 million open interest.
The futures trade-count data also differs from the volume rankings. BingX recorded roughly 1.12 million trades, while LBank reached 623,600. Binance followed with approximately 513,340 trades.
The combined charts show momentum cooling after a sustained September recovery. RSI weakness and the Parabolic SAR shift reinforce that changing structure. Meanwhile, elevated derivatives activity leaves the market sensitive to sharp price movements.
The $0.20 area continues to be the initial negative level on the chart. Below those are listed the levels going up to $0.19 and $0.175. The final marked area sits near $0.16 if broader weakness continues.