XRP opened June trading at $1.30, down roughly 2% in 24 hours, after its May monthly candle closed below a key Bollinger Bands midline that now acts as resistance. The technical setup has pro
XRP opened June trading at $1.30, down roughly 2% in 24 hours, after its May monthly candle closed below a key Bollinger Bands midline that now acts as resistance. The technical setup has prompted analysts to warn that a slide below $1 is a realistic scenario this month.
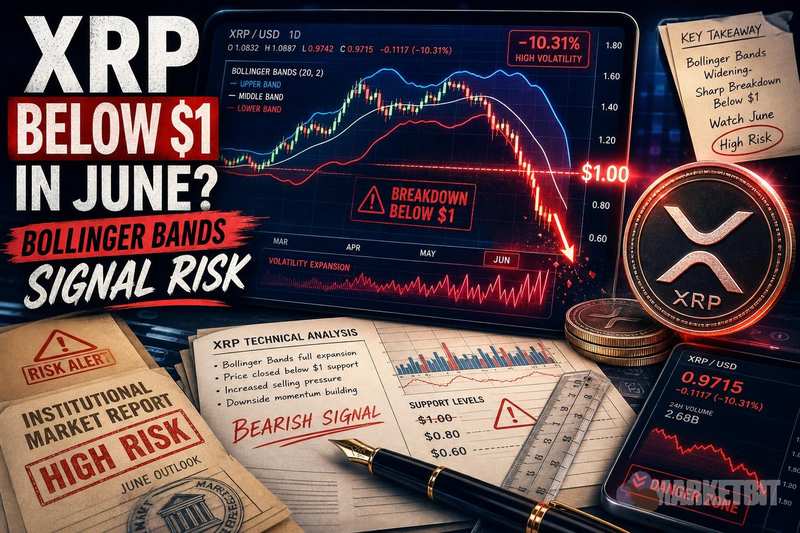
Why Bollinger Bands Are Putting XRP Under Pressure
The bearish signal centers on XRP's monthly chart. According to U.Today's June 1 analysis, XRP closed May below the Bollinger Bands middle line, which now sits at $2.0710 and functions as overhead resistance.
Bollinger Bands measure volatility by plotting standard-deviation channels around a moving average. When price closes below the midline and trends toward the lower band, it signals that sellers are in control and further downside is statistically favored.
The monthly lower Bollinger Band sits at $0.9671, which is roughly 25% below the current spot price. That level is the source of the sub-$1 warning: if XRP continues to drift lower through June, the band marks a plausible destination.
Monthly Lower Bollinger Band $0.9671 The cited downside band is roughly 25.6% below the $1.30 spot reference.
On the weekly chart, the picture is similarly weak. XRP was pressing against the weekly lower Bollinger Band at $1.1810, and the relative strength index had fallen to 44.36, below the neutral 50 level but not yet in oversold territory.
What to Know
- The signal: XRP's May close fell below the monthly Bollinger midline ($2.0710), flipping it to resistance.
- The price level: The monthly lower band at $0.9671 marks the technical downside target, just under $1.
- The timeframe: June has historically averaged a 4.87% decline for XRP, according to unconfirmed seasonality data cited in the original analysis.
Earlier this year, a separate Cointelegraph analysis flagged a symmetrical-triangle breakdown that projected a $0.95 XRP target, roughly 29% below the price at that time. That report also noted that more than 472 million XRP worth approximately $652 million had moved to exchanges, a pattern typically associated with selling pressure.
What a Drop Below $1 Would Mean for XRP Sentiment
The $1 mark is more than just a round number. It has served as a psychological anchor for XRP holders through multiple market cycles, and a clean break below it would be the first since late 2024.
XRP currently trades at $1.30, with a market cap near $80.9 billion and 24-hour volume of roughly $1.48 billion. While the token remains well above the sub-$1 danger zone, the gap is narrowing.
XRP Spot Price $1.30 24-hour change: -2.22%.
A decisive move below $1 would likely trigger a shift in trader positioning. Round-number supports tend to accumulate stop-loss orders, meaning a breach could accelerate selling as those stops are hit. For an asset with XRP's trading volume, that cascade can be sharp.
The broader crypto market sentiment is already tilted bearish. The Fear and Greed Index registered 29 on June 1, firmly in "Fear" territory. That backdrop reduces the likelihood of a strong bid materializing to defend the $1 level if XRP approaches it.
Supply-side dynamics add another layer of concern. Ripple's periodic release of XRP from escrow has historically drawn scrutiny from traders who worry about dilution, even though much of the unlocked supply is typically re-locked.
What Traders Should Watch for Through June
The bearish case hinges on follow-through. One monthly close below the midline is a warning, not a guarantee. Traders monitoring this setup should focus on three signals.
Weekly lower band behavior. If XRP breaks below the weekly lower Bollinger Band at $1.1810 with rising volume, it would confirm that the monthly signal is translating into real selling pressure. A bounce off that level, conversely, would suggest the band is acting as support.
The $1 level itself. Price action near $1 will determine whether this remains a theoretical risk or becomes a live event. A wick below $1 followed by a quick recovery would signal a bear trap. A sustained daily close below $1 would be more significant.
RSI divergence. The weekly RSI at 44.36 is declining but not yet oversold. If RSI drops below 30 while price holds above $1, it could signal exhaustion of selling momentum, a pattern that has preceded short-term bounces in previous XRP cycles.
Events outside XRP's chart could also shift the picture. Developments in stablecoin regulation, such as the recent court-ordered freeze of USDC contracts, illustrate how quickly regulatory actions can ripple across crypto markets and alter sentiment for assets like XRP.
Security incidents also remain a wildcard. Recent bridge exploits have reminded traders that technical risks extend beyond price charts, reinforcing the cautious tone reflected in the Fear and Greed reading.
The bearish case weakens if XRP reclaims the $2.07 Bollinger midline on a monthly closing basis. That would negate the current setup entirely and shift the bias back to neutral. Until then, the technical evidence favors caution through June.
Disclaimer: This article is for informational purposes only and does not constitute financial or investment advice. Cryptocurrency and digital asset markets carry significant risk. Always do your own research before making decisions.
Read original article on marketbit.net