XRP is trading near $1.2775, up about 2.02% on the day. It bounced from a low of $1.2420. The move comes after reports that Democrats won the US Senate and the House. Many crypto traders see
XRP is trading near $1.2775, up about 2.02% on the day. It bounced from a low of $1.2420.
The move comes after reports that Democrats won the US Senate and the House. Many crypto traders see that as a less friendly outcome than Republican control.
The chart is still stuck in a downtrend. So the bounce faces a real test.
Democrat Senate Win Rattles Crypto Traders
Democrats flipped states that Donald Trump won by double digits in 2024. Texas and Kansas elected Democrats to the Senate for the first time in decades.
Republican leaders and the Trump administration had pushed for stablecoin rules and self-custody protections. Traders now wonder if that push slows down.
Nothing is final yet. Still, politics can move the mood fast, and crypto often reacts first.
Derivatives Data Shows Shorts Slightly Ahead
Activity around XRP is rising, but not in one clear direction. Here is the snapshot.
Metric
Value
Price
$1.2775 (+2.02%)
Market Cap
$80.37 billion
Futures Volume (24h)
$2.72 billion
Spot Volume (24h)
$552.77 million
Open Interest
$2.88 billion (-1.39%)
Options Volume
$13.26 million (+154.12%)
Options Open Interest
$74.06 million (+16.58%)
Long/Short Ratio (24h)
0.9635
Liquidations (24h)
$6.86 million
The 24-hour long/short ratio of 0.9635 means shorts lead by a small margin. But Binance account data shows 2.5676, and OKX shows 3.25. Top traders on Binance sit at 1.9701 by position size.
Longs lost $3.96 million over 24 hours, while shorts lost $2.90 million. In the last four hours, longs took most of the pain with $1.08 million lost, against $205.52K for shorts.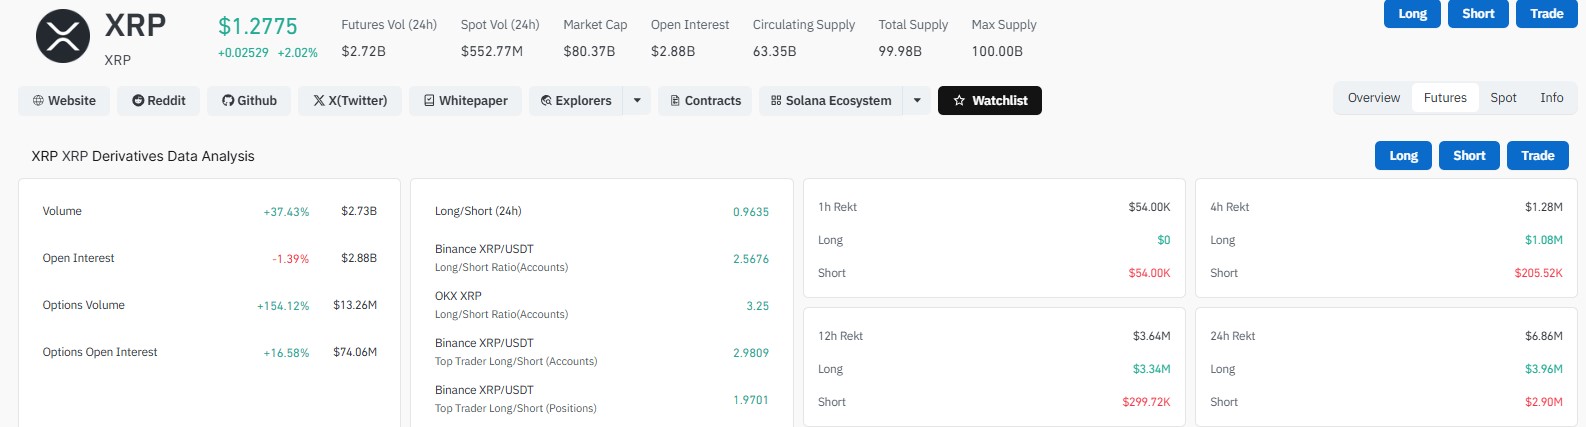
Bollinger Squeeze Fuels Breakout Talk
Analyst Ali Charts says the token just logged its tightest Bollinger Band squeeze since August on the 4-hour chart. He notes that price has now pushed above the upper band.
The last time the bands were this tight, the coin rallied about 71% in three days. That is a past result, not a promise.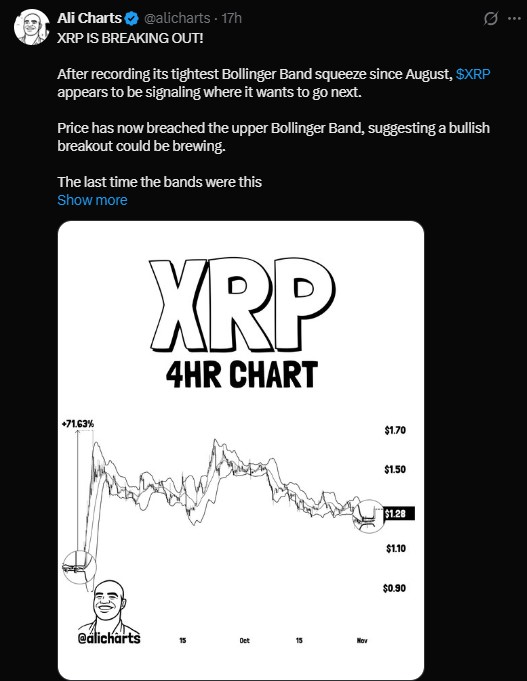
Daily Chart Still Shows a Falling Channel
The daily chart tells a calmer story. Price has moved lower inside a descending channel since late September.
The coin sits near the lower Bollinger Band at $1.2294. The middle band is at $1.2943, and the upper band is at $1.3592.
RSI is at 42.68, above its signal line at 39.89. That points to weak momentum, but with small signs of recovery.
Inverse Head and Shoulders Adds a Bullish Angle
Analyst Javon Marks points to an inverse head and shoulders pattern on a larger chart. He says a reversal toward all-time highs could be in the works.
His chart compares the setup with an earlier one from Bapital. A pattern is just a map, though. XRP still sits below the neckline on that chart.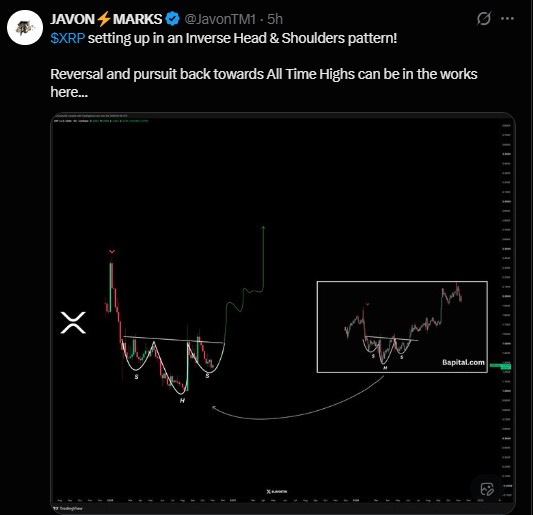
Key Levels to Watch
Level
Type
Why It Matters
$1.3592
Resistance
Upper Bollinger Band on the daily chart
$1.32
Resistance
Bulls need a daily close above this
$1.2943
Resistance
Middle Bollinger Band and channel top
$1.25
Support
First stop if buyers fail at the channel
$1.2294
Support
Lower Bollinger Band
What Could Happen Next
The first wall is the $1.2943 to $1.32 zone. If bulls win it back and close a daily candle above $1.32 with strong volume, a channel breakout becomes more likely. That could open a path toward $1.36 and $1.40.
If buyers fail there, a rejection could send price back to $1.25. A retest of $1.23 would follow.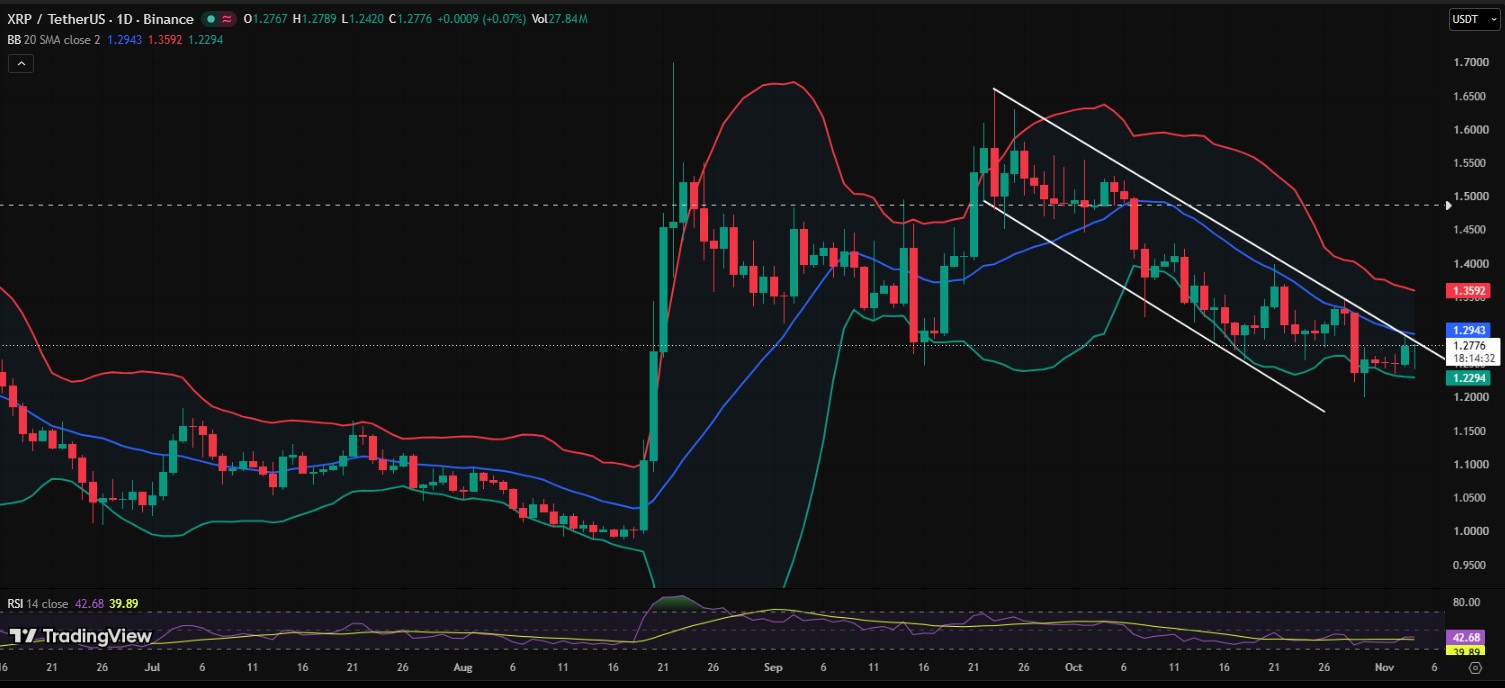
The signals are mixed. The 4-hour chart looks hopeful, the daily chart looks tired, and the Senate news adds a new worry. Traders will likely watch volume and the $1.32 close first.
Disclaimer
This article is for information only and is not financial advice. Cryptocurrency prices are volatile, and you can lose some or all of your money. Past performance does not guarantee future results. Do your own research and speak with a licensed financial advisor before making any investment decision.