Structure points toward continuation, but confirmation above wedge resistance remains necessary before the broader target activates. RLUSD activity adds network context, while current price a
- Structure points toward continuation, but confirmation above wedge resistance remains necessary before the broader target activates.
- RLUSD activity adds network context, while current price action still shows short-term selling pressure around established support levels.
- A move beyond $15 depends on repeated structural confirmation, with the smaller wedge serving as the immediate technical trigger now.
XRP breakout signals are developing alongside strong RLUSD growth, while the latest chart structure keeps longer-term upside targets under watch.
Bullish Structure Builds Around Historical Patterns
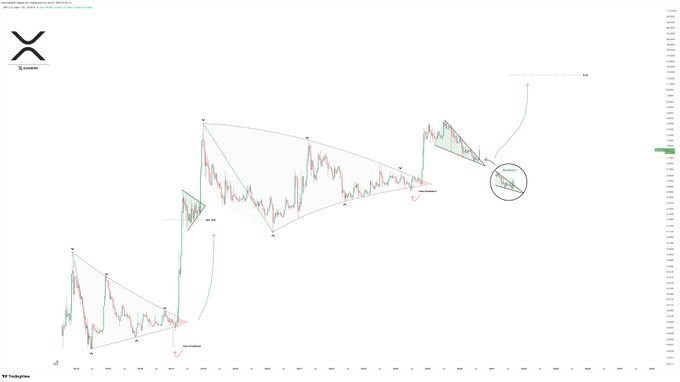
The broader chart shows XRP moving through several contracting formations. Earlier breakouts preceded sharp advances and extended continuation phases. The current structure follows a broadly comparable sequence of compression and expansion.
JAVONMARKS recently pointed to this historical behavior in his XRP analysis. He referenced XRP’s move from roughly $0.50 toward above $3.30 previously. His comparison centers on structural similarities between earlier and current formations.
Source:
XThe larger formation features descending resistance and gradually rising lower boundaries. This compression creates a narrowing range between opposing trendlines. A sustained break from that range could determine the next directional phase.
The price as of writing, stands at $1.41, following a decline from approximately $1.47. Price recently failed to maintain the $1.44 area after reaching higher intraday levels. That weakness keeps immediate confirmation necessary before the broader bullish structure strengthens.
The latest formation resembles a smaller descending wedge or bullish flag. Its boundaries continue compressing after the preceding upward movement. Such structures require a confirmed resistance break before continuation becomes technically established.
Marks identifies this smaller formation as the next potential catalyst. His projected measured move reaches approximately $15 after a successful breakout. The projection therefore depends on confirmation rather than the target itself.
The historical comparison extends back to XRP’s 2017 market structure. Marks notes that XRP reached a similar measured objective during that cycle. Price subsequently exceeded that objective by a considerable margin.
For the present setup, $1.40–$1.41 remains an important support area. Holding that zone could provide room for another recovery attempt. Meanwhile, $1.43–$1.44 represents an immediate resistance area above current levels.
RLUSD Growth Adds Network Activity to the Setup
Shaminem recently highlighted contrasting stablecoin trends involving the XRP Ledger. Total stablecoin supply reportedly declined 6% since May. Meanwhile, RLUSD supply on XRPL increased 39% to approximately $934 million.
The data also shows considerable RLUSD issuance and redemption activity. Around $450 million was issued during the past 30 days. Another $450 million was reportedly redeemed over the same period.
That turnover indicates active movement through the RLUSD market rather than simple supply expansion. The figures also show substantial dollar-denominated activity across the XRPL ecosystem. However, RLUSD circulation does not directly require equivalent XRP purchases.
The combined picture remains dependent on technical confirmation and support retention. A break above the smaller wedge would strengthen the continuation structure. Conversely, losing $1.40 could weaken the setup and shift attention toward further downside.