XRP's nine-year consolidation is still not resolved, traders are waiting for a confirmation of a possible long-term breakout on established resistance. The $5.40 mark is still a forecast, and
- XRP's nine-year consolidation is still not resolved, traders are waiting for a confirmation of a possible long-term breakout on established resistance.
- The $5.40 mark is still a forecast, and XRP wouldn't be able to advance if it didn't break out and hold an upward trend.
- XRP trades below its nine-day EMA, while an RSI reading under 50 signals weakening short-term momentum near support.
The overall XRP price outlook is tied to the market's technical weakness and a deep consolidation that may be a precursor to a major move.
Nine-Year Consolidation Shapes the Long-Term Outlook
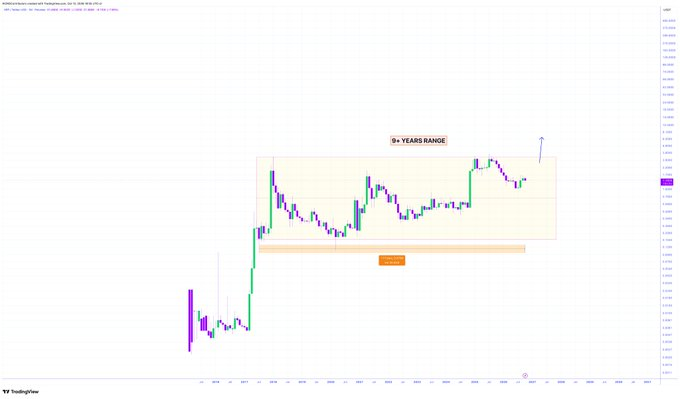
Crypto analyst CRYPTOWZRD recently described XRP's trading history as a nine-year consolidation. The analyst argued that an eventual breakout could trigger substantial expansion. A long-term target of $5.40 was also presented as a possibility.
Source:
X
The argument rests on XRP's extended movement within a broad historical trading range. Over the years, price has experienced rallies, pullbacks, and repeated resistance tests. But the market has not yet confirmed that the sustained expansion mentioned in this bull market scenario is there.
During a market turn, long consolidations can lead to good price action. But a length of a trading range does not always indicate a trend it will take. Confirmation requires price to move beyond established boundaries with sustained buying interest.
CRYPTOWZRD's projection therefore depends on a breakout rather than consolidation alone. A sustained move above resistance would strengthen the proposed bullish scenario. Conversely, another rejection would indicate that sellers continue controlling the upper boundary.
Current Price Action Shows Mounting Pressure
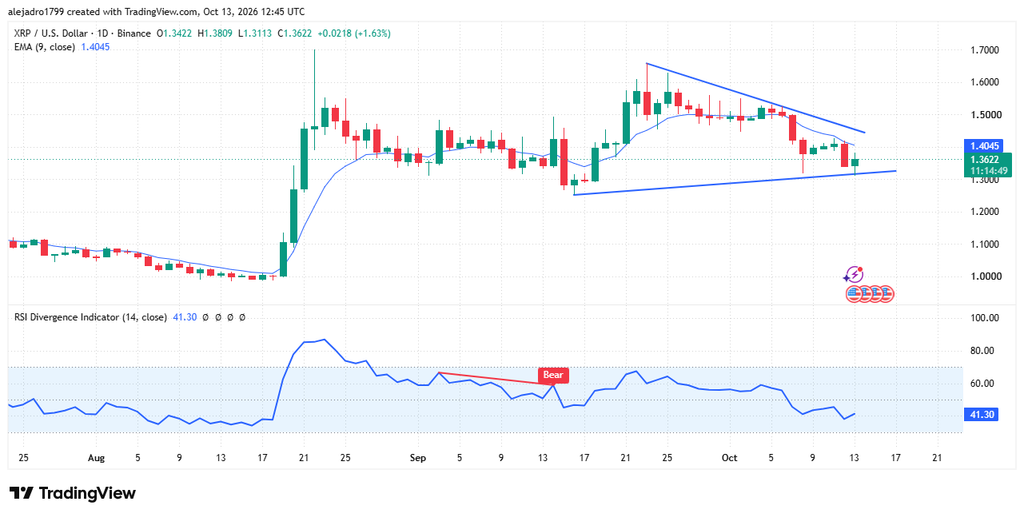
XRP was hovering around $1.3584 on the daily Binance chart on October 13, 2026. It has been down from its previous rise to about $1.60 in September. The following lower highs have suggested a loss of momentum.
Source:
Tradingview
The triangle is symmetric indicating increasing competition from buyers and sellers. The triangle is symmetrical, indicating intensifying rivalry among buyers and sellers. Its eventual resolution could establish the next directional trend.

XRP is trading below its nine-day exponential moving average near $1.4037. This positioning indicates that short-term momentum currently favors sellers. A recovery above the average would provide an initial signal of improving price strength.
The Relative Strength Index is close to 40.75 which is below the neutral level of 50. This reading suggests weakening momentum, although it does not indicate extreme oversold conditions. Earlier bearish RSI divergence also preceded the recent decline from September's higher levels.
Support and Resistance Determine the Next Move
The 1.30–1.32 region represents immediate support along the rising trendline. Buyers need to defend this area to preserve the triangle's existing structure. A successful defense could encourage a recovery toward the nine-day moving average.
Above that average, resistance emerges around 1.45–1.48 along the descending trendline. A confirmed breakout through this zone would improve the short-term technical picture. XRP could then attempt to revisit $1.50 and the September highs near $1.60.
However, a daily close below $1.30 would weaken the bullish structure. Such a breakdown could expose lower support around $1.25 and potentially $1.20. Expanding selling volume would strengthen evidence of a bearish continuation.
The daily setup is not sufficient to make a long term projection of $5.40. XRP will need to find the next level of support to resume growth toward that price action. This provided chart does not set a timeframe for achieving it.
The market offers a choice of two scenarios for now and no clear direction on the signals. A continuation of the support could maintain the consolidation, whereas a failure to do so could raise downside risks. Any trader will require price confirmation before deciding if the overall bullish expectation is valid.