XRP ETF flows remain positive at $1.01 million, although weekly inflows dropped sharply from the previous $14.9 million reading. Spot products now hold 1.49% of supply, while March remains th
- XRP ETF flows remain positive at $1.01 million, although weekly inflows dropped sharply from the previous $14.9 million reading.
- Spot products now hold 1.49% of supply, while March remains the only month recording net ETF outflows so far.
- Institutional demand remains active, but weaker inflows and XRP’s recent decline require closer monitoring of future ETF data.
XRP ETF flows remain positive despite slower institutional buying, while cumulative holdings continue expanding across listed investment products.
Weekly Inflows Remain Positive
The latest figures show $1.01 million entering spot XRP ETFs during the week. That remains positive, although the pace has weakened considerably from earlier activity. The previous week recorded approximately $14.9 million in net inflows.
The difference between both periods shows a clear moderation in institutional capital allocation. However, positive flows still indicate net additions rather than broad investor withdrawals. Therefore, the latest reading preserves the broader positive flow direction.
BSCN reported the figures while describing the week as bullish for XRP. The update also noted that ETF holdings reached 1.49% of total supply. That ownership level gives listed products a growing presence within the asset's institutional market.
https://twitter.com/BSCNews/status/2085855756042055882?s=20
At the same time, the latest inflow should not be viewed independently. Weekly figures can vary substantially as institutional allocations change. Consistent readings across several weeks would provide a clearer indication of underlying demand.
ETF Ownership Continues Expanding
Spot XRP ETFs reportedly control approximately 1.49% of the token's supply. That figure represents a measurable allocation through regulated investment products. It also provides context for the increasing institutional presence surrounding XRP.
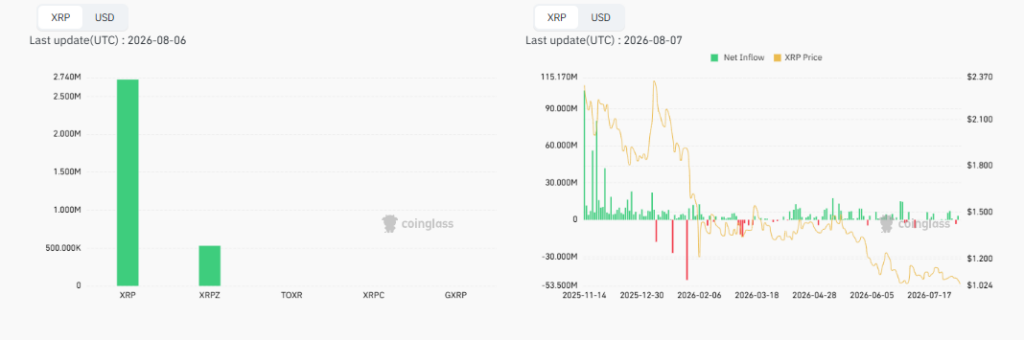
The supplied data shows only one month with net ETF outflows since launch. March 2026 recorded withdrawals totaling approximately $31.16 million. Other periods have reportedly maintained a generally positive flow pattern.

That history separates the current slowdown from a sustained institutional exit. Recent inflows remain positive despite the reduction from last week's stronger figure. Still, the March outflow confirms that investor positioning can change during weaker market conditions.
ETF holdings also should not be treated as permanently removed supply. Investors can enter or exit funds as market conditions change. Consequently, future flow figures remain essential when evaluating institutional positioning over time.
Market Activity Shows Mixed Conditions
The broader ETF data shows approximately $15.17 million in total trading volume. Total market capitalization across the displayed products stands near $650.47 million. Bitwise's XRP ETF represents the largest listed product shown, with about $231.14 million.
Source:
CoinglassThe displayed XRP-related products are concentrated around the primary vehicle. XRP records roughly 2.74 million in the shown metric, while XRPZ reaches approximately 520,000. Other products remain considerably smaller within the displayed comparison.
Meanwhile, XRP as of writing trades at $1.04, with approximately $1.11 billion in daily volume. The asset has gained 0.12% over 24 hours but remains down 2.21% across seven days. This price action shows that ETF demand has not prevented recent market weakness.
The flow chart also shows that institutional activity has not always matched price direction. Earlier periods featured substantial inflows alongside stronger prices, followed by greater volatility. Future readings will therefore show whether current demand strengthens or remains relatively restrained.