Evernorth’s planned Nasdaq listing brings public-market attention to its 473 million XRP treasury and reported $300 million in gross cash proceeds. The daily chart of XRP is displaying resist
- Evernorth’s planned Nasdaq listing brings public-market attention to its 473 million XRP treasury and reported $300 million in gross cash proceeds.
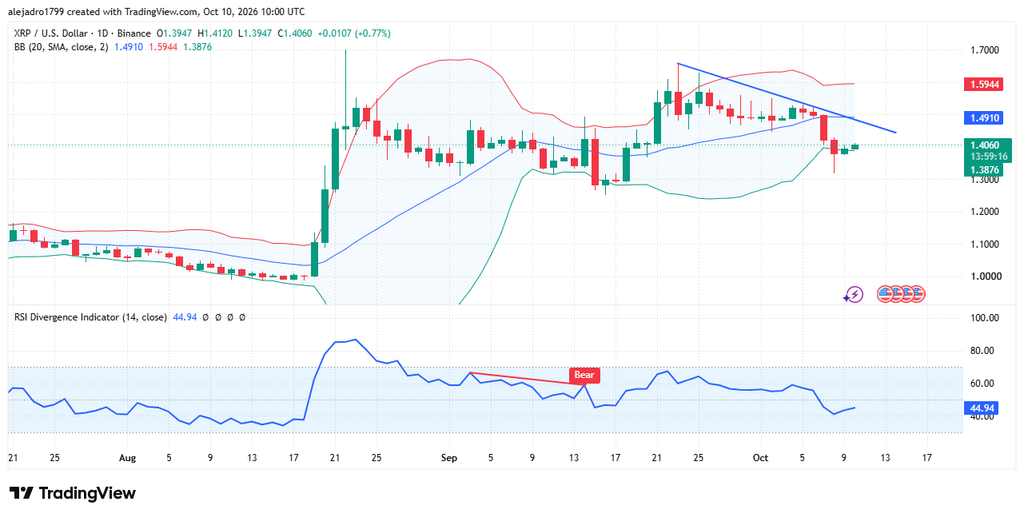
- The daily chart of XRP is displaying resistance at $1.49, declining resistance and an RSI reading below 50, indicating resistance in the cryptocurrency.
- A sustained break above resistance could improve the chart structure, while losing $1.3881 may expose the next support area near $1.30.
XRP is set to undergo a technical challenge while Evernorth is set to go public on the Nasdaq, as institutional exposure and chart momentum become key factors for market participants.
Evernorth Listing Brings XRP Treasury Into Focus
Coin Bureau reported that Ripple-backed Evernorth completed its SPAC merger and raised approximately $300 million. The company holds around 473 million XRP, according to the announcement. Its shares are expected to begin trading on Nasdaq under XRPN on October 12.
https://twitter.com/coinbureau/status/2108743066203111533?s=20
The planned listing offers investors exposure through a publicly traded company rather than direct token ownership. Shareholders would own an interest in Evernorth, not XRP held in personal wallets. Consequently, the share price may reflect corporate performance alongside movements in the cryptocurrency market.
Evernorth’s treasury exposes the company to changes in XRP’s market value. Rising prices could increase its holdings’ value, while declines could reduce it. Rising prices could increase its holdings’ value, while declines could reduce it. Cash proceeds from the reporting transaction are additional resources, but transaction costs may reduce the available cash.
The company has detailed plans regarding infrastructure, decentralized finance, and institutional strategies. The effort focuses on bringing its treasury in line with the overall activity in the XRP ecosystem. They will eventually contribute according to execution, demand and market.
XRP Price Shows Weakening Technical Momentum
The daily chart records a sharp August rally from approximately $1.00 toward $1.50. XRP advanced again in late September, approaching $1.60 before sellers regained control. The subsequent pullback has left the market struggling to regain upward momentum.
Source:
Tradingview
The latest displayed price is $1.4082, following a modest daily recovery. The middle Bollinger Band is near $1.4911 and the lower Bollinger Band is near $1.3881. These levels are used to mark the near-term resistance and support areas.
The recent lower highs form a descending blue trend line and further confirm overhead resistance. The structure would be improved if the $1.49 area could be recovered. However, buyers would also have to test the trendline to support the breakout scenario.
RSI is currently 45.24, which is below its average level of 50. The reading shows that bulls are losing momentum, but RSI is still above normal over-sold levels. There's also bearish divergence around mid-September that predates the recent sell-off.
Key XRP Levels Define the Next Move
The immediate support is near the lower Bollinger Band at $1.3881. A decisive breakdown could expose the $1.30 area to another test. Holding above this zone could instead give buyers room to establish a base.
One bounce isn't enough to signal the end of selling. Better evidence of improving demand would be stronger daily closes. Momentum would also need to recover to support a more convincing reversal.
On the upside, $1.4911 marks the first important hurdle. Reclaiming this level could bring descending resistance back into focus. A successful breakout may open a challenge toward the upper Bollinger Band near $1.5942.
Evernorth’s planned debut may attract further attention to XRP-related public-market exposure. However, the listing does not determine the token’s immediate direction. XRP and XRPN can respond differently to liquidity, sentiment, and company-specific developments.
For now, the chart shows a market testing support beneath clear overhead resistance. A sustained move above $1.49 would improve the technical outlook, while losing $1.3881 would weaken it. Until either level breaks decisively, XRP’s next direction remains uncertain.