The XRP/USD daily chart showed price at $1.3082 on October 17 at 06:46 UTC. Its low of $1.30 left XRP above the $1.26-$1.279 range, where two longer-term moving averages meet a Fibonacci retr
The XRP/USD daily chart showed price at $1.3082 on October 17 at 06:46 UTC. Its low of $1.30 left XRP above the $1.26-$1.279 range, where two longer-term moving averages meet a Fibonacci retracement.
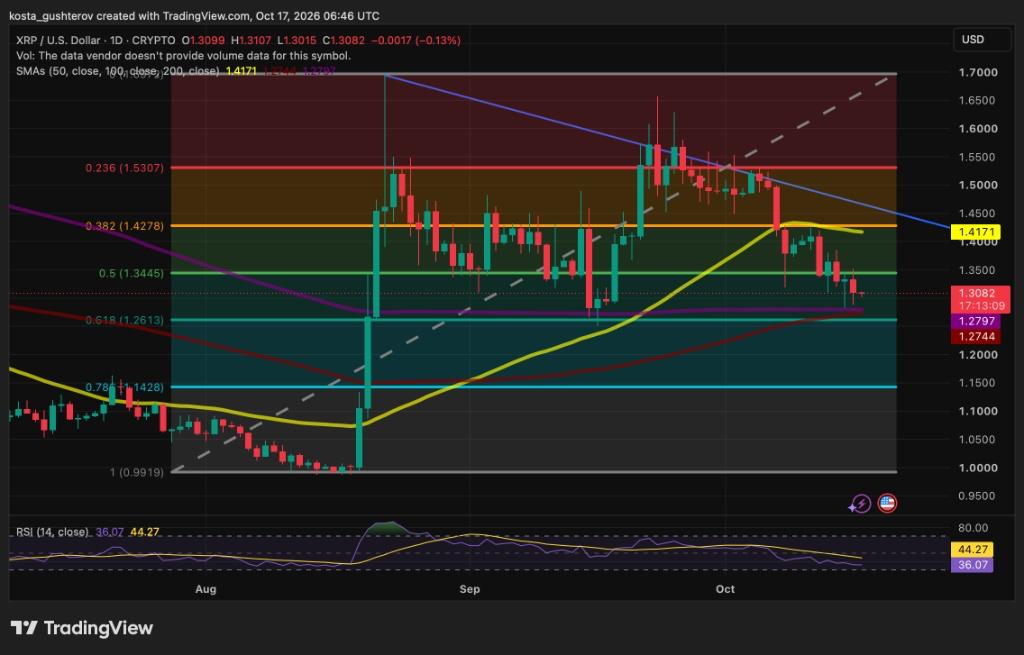
XRP approaches the $1.26-$1.28 support cluster.
The chart has changed in a specific way: $1.34 has shifted from support to resistance. XRP can bounce from the lower range, but it must reclaim $1.34 before that bounce begins to repair the breakdown.
XRP has given up the midpoint of its prior rally
XRP’s latest decline follows a failed attempt to sustain a recovery above $1.34. Price has broken below its rising trendline and the 50-day simple moving average, while a descending resistance line from the measured rally high remains above the market.
That is a weaker setup than during the earlier recovery above $1.34, when XRP was trying to reach the $1.42-$1.43 resistance area. The support range identified in that analysis is now much closer, although the current candle has not reached it.
The Fibonacci grid measures the move from $0.99 to the $1.70 local high. XRP has fallen about 23% from that high and now trades below the 50% retracement at $1.34.
A move back above $1.34 would be the first repair, not a full trend reversal. XRP would still have to deal with the 50-day average, the 38.2% retracement and the descending trendline above.
The next test sits between $1.26 and $1.28
The 200-day SMA stands at $1.279, the 100-day SMA at $1.274 and the 61.8% Fibonacci retracement at $1.26. These are different tools pointing to the same small price area: the averages track longer price trends, while the retracement measures how far XRP has pulled back from its prior advance.
At $1.30, XRP was still about 2.2% above the upper edge of the range and 3.6% above its lower boundary. It is approaching the area, not testing the whole band yet. A brief wick into the range would be less meaningful than a close back above it after a sell-off.
Daily relative strength index, or RSI, stood at 36.07, below the neutral 50 mark and its smoothing line at 44.27. The reading fits the current weak momentum, but it is still above the conventional oversold threshold of 30. RSI alone does not show that sellers are finished.
Follow the price route
- $1.34: The lost 50% retracement is XRP’s first recovery level. Holding back above it would show that the breakdown is losing force.
- $1.26-$1.279: The 61.8% retracement, 100-day SMA and 200-day SMA meet here. This is the first area where a more substantial response from buyers would matter.
- $1.14: The 78.6% retracement becomes relevant only if XRP closes below the nearer range and cannot recover it.
- $1.417-$1.427, then $1.53: A sustained recovery would still need to clear the 50-day average, the 38.2% retracement and the falling trendline before XRP could target higher resistance.
Retail attention arrived early, then faded before futures did
The sharp shift in XRP retail search interest is visible in Google activity. The worldwide Google Trends series for “xrp” reached 100 in December 2024 and remained high at 91 in January 2025. By October 2026, the reading had dropped to 16, a partial-month result that is 84% below the historical peak.
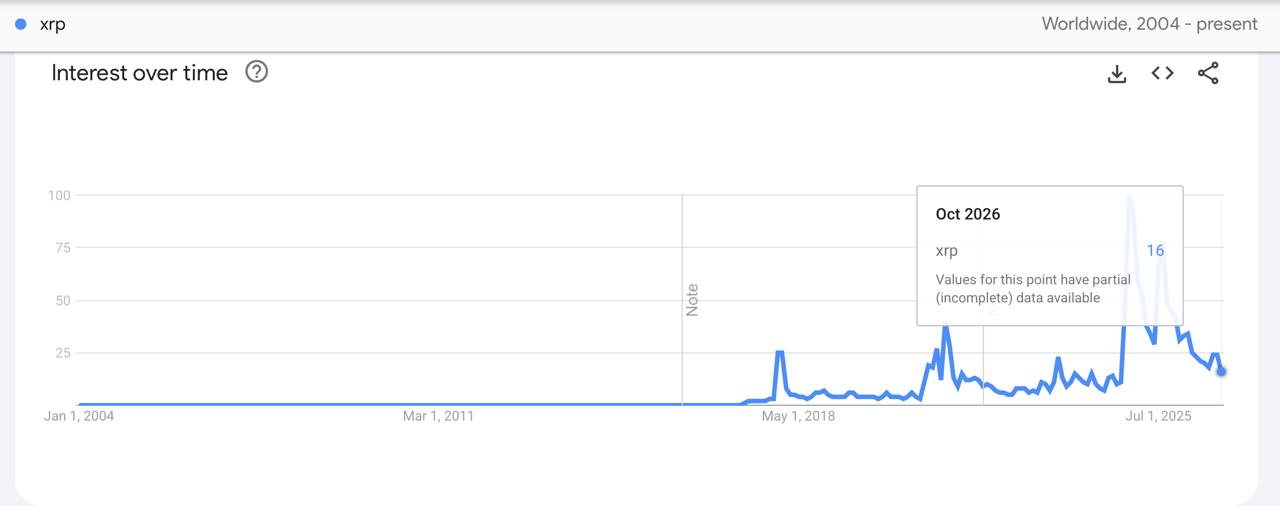
XRP searches fade after the 2024 peak.
Futures exposure did not peak at the same time. The CoinGlass chart shows XRP open interest continuing to build after the search spike, eventually rising above $10 billion around July. Retail curiosity came first; the largest build-up in derivatives positions followed months later.
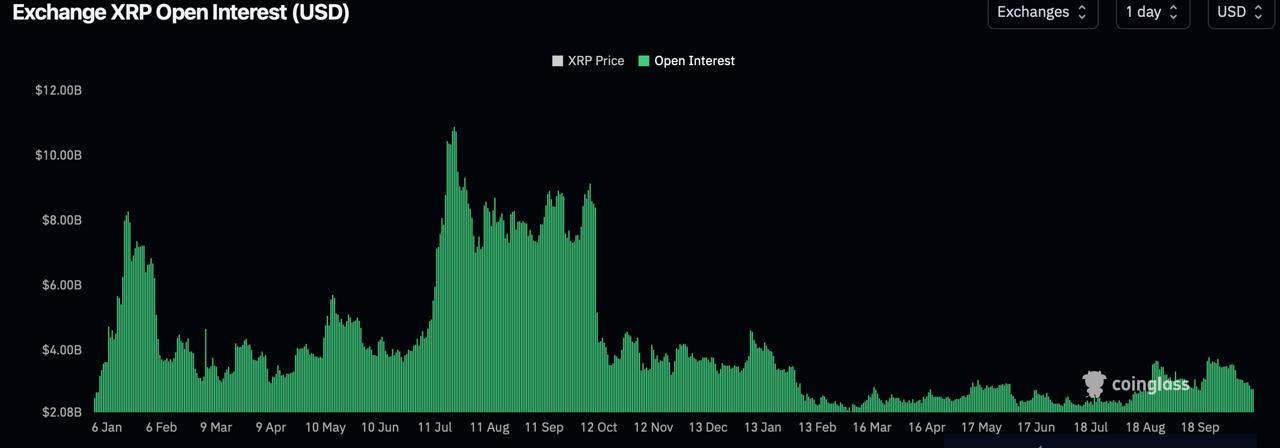
XRP open interest remains below its peak.
Both measures have since cooled. CoinGlass listed XRP futures open interest at about $2.80 billion, well below the earlier area near $11 billion. After falling from that peak, it recovered into the roughly $3 billion-$4 billion range during later bursts of activity, but did not return to the previous high.
Google Trends does not count investors or their trades. It measures XRP’s share of searches, normalized for the selected period and geography. Open interest is also not directional because it includes both long and short positions, while its dollar value can fall alongside XRP’s price.
The charts show a much cooler backdrop than during XRP’s earlier run. They cannot determine whether the $1.26-$1.28 support range will hold. That answer will come from the price reaction and the participation behind it.
The support reaction could set the next direction
If XRP reaches $1.26-$1.28 and rebounds, the first test would be $1.34. A daily close above that level, followed by the ability to hold it on a pullback, would carry more weight than a single green candle near support.
Above $1.34, XRP would face $1.417-$1.427, where the 50-day average sits near the 38.2% retracement. The descending trendline remains a further obstacle. Only after those references are recovered would $1.53 come back into focus.
If XRP closes below $1.26 and cannot regain the range, attention would shift to $1.142. A break below that level would leave $0.99, the starting point of the measured rally, as the deeper reference.
Spot volume and contract-denominated open interest would offer a clearer read on participation around that support test than search interest alone.
This article is provided for informational purposes only and does not constitute financial or investment advice. Technical indicators and market data are interpretive tools, not guarantees of future price movement.
The post XRP: Google Trends Reveal Shocking Shift in Retail Interest appeared first on Coindoo.