XRP had a moment last weekend that bulls had been waiting on for weeks. The price climbed from $1.14 all the way to $1.29, hitting a technical breakout target that chart analysts had flagged
XRP had a moment last weekend that bulls had been waiting on for weeks. The price climbed from $1.14 all the way to $1.29, hitting a technical breakout target that chart analysts had flagged with quiet confidence. For a brief stretch, it looked like the altcoin was finally shaking off the weight of months of underperformance. That optimism did not last long. The rejection that followed was sharp, the volume dried up almost immediately, and now the XRP price analysis is pointing in a direction that swing traders probably do not want to hear about.
What the Symmetrical Triangle Was Actually Telling the Market
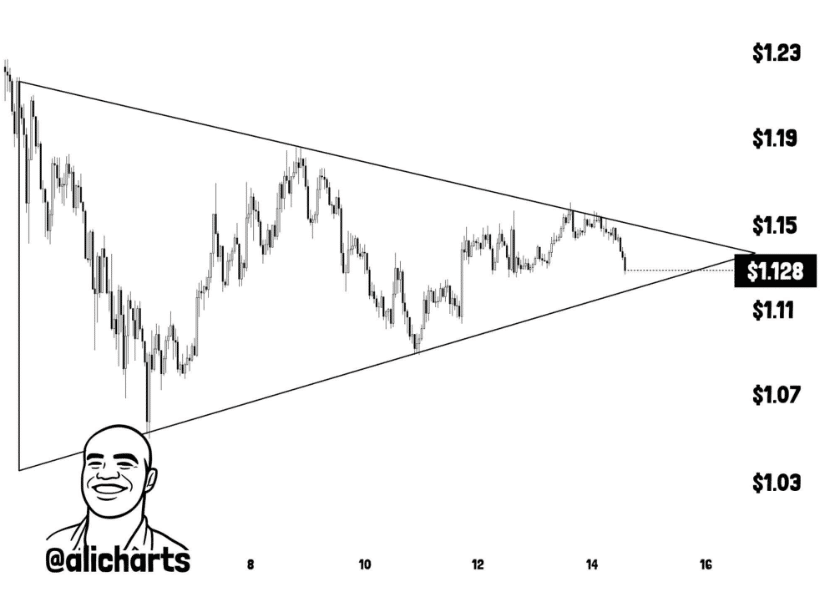
The symmetrical triangle formation had been building for weeks before the breakout materialized. Crypto analyst Ali Martinez was among the first to flag the setup on social media, noting that the pattern carried a projected 14% breakout target, which in practical terms meant XRP had a realistic path to $1.30. The price got close, touching $1.29 before getting turned away at the doorstep of that key resistance zone. For technical traders, hitting a breakout target is a meaningful event, but what happens at that target matters just as much as reaching it.
The rejection from $1.298 on the 4-hour chart landed almost precisely at the 78.6% Fibonacci retracement level, one of the more significant resistance points in standard technical analysis. Fibonacci retracement levels are drawn between a major high and low to identify where price tends to slow down or reverse, and the 78.6% mark is historically one of the trickiest for bulls to push through. Prices reaching that level after a downtrend often attract sellers who view it as a prime exit point rather than a launchpad.
XRP Price Analysis: Volume and Demand Paint a Concerning Picture
Beyond the chart patterns, there are real warning signs embedded in the current XRP price analysis. Daily trading volume fell by 44% during the recent bounce, which in market terms is roughly like an engine losing fuel mid-acceleration. When price rises on shrinking volume, it signals that fewer participants are buying into the move, making the rally structurally fragile.
The demand picture gets more complicated when considering where the buying actually came from. The surge from $1.14 was disproportionately concentrated on the South Korean exchange Upbit, rather than reflected uniformly across global platforms. Geographically concentrated demand often points to speculative or sentiment-driven buying rather than the kind of broad institutional accumulation that typically sustains a genuine trend reversal in any major digital asset.
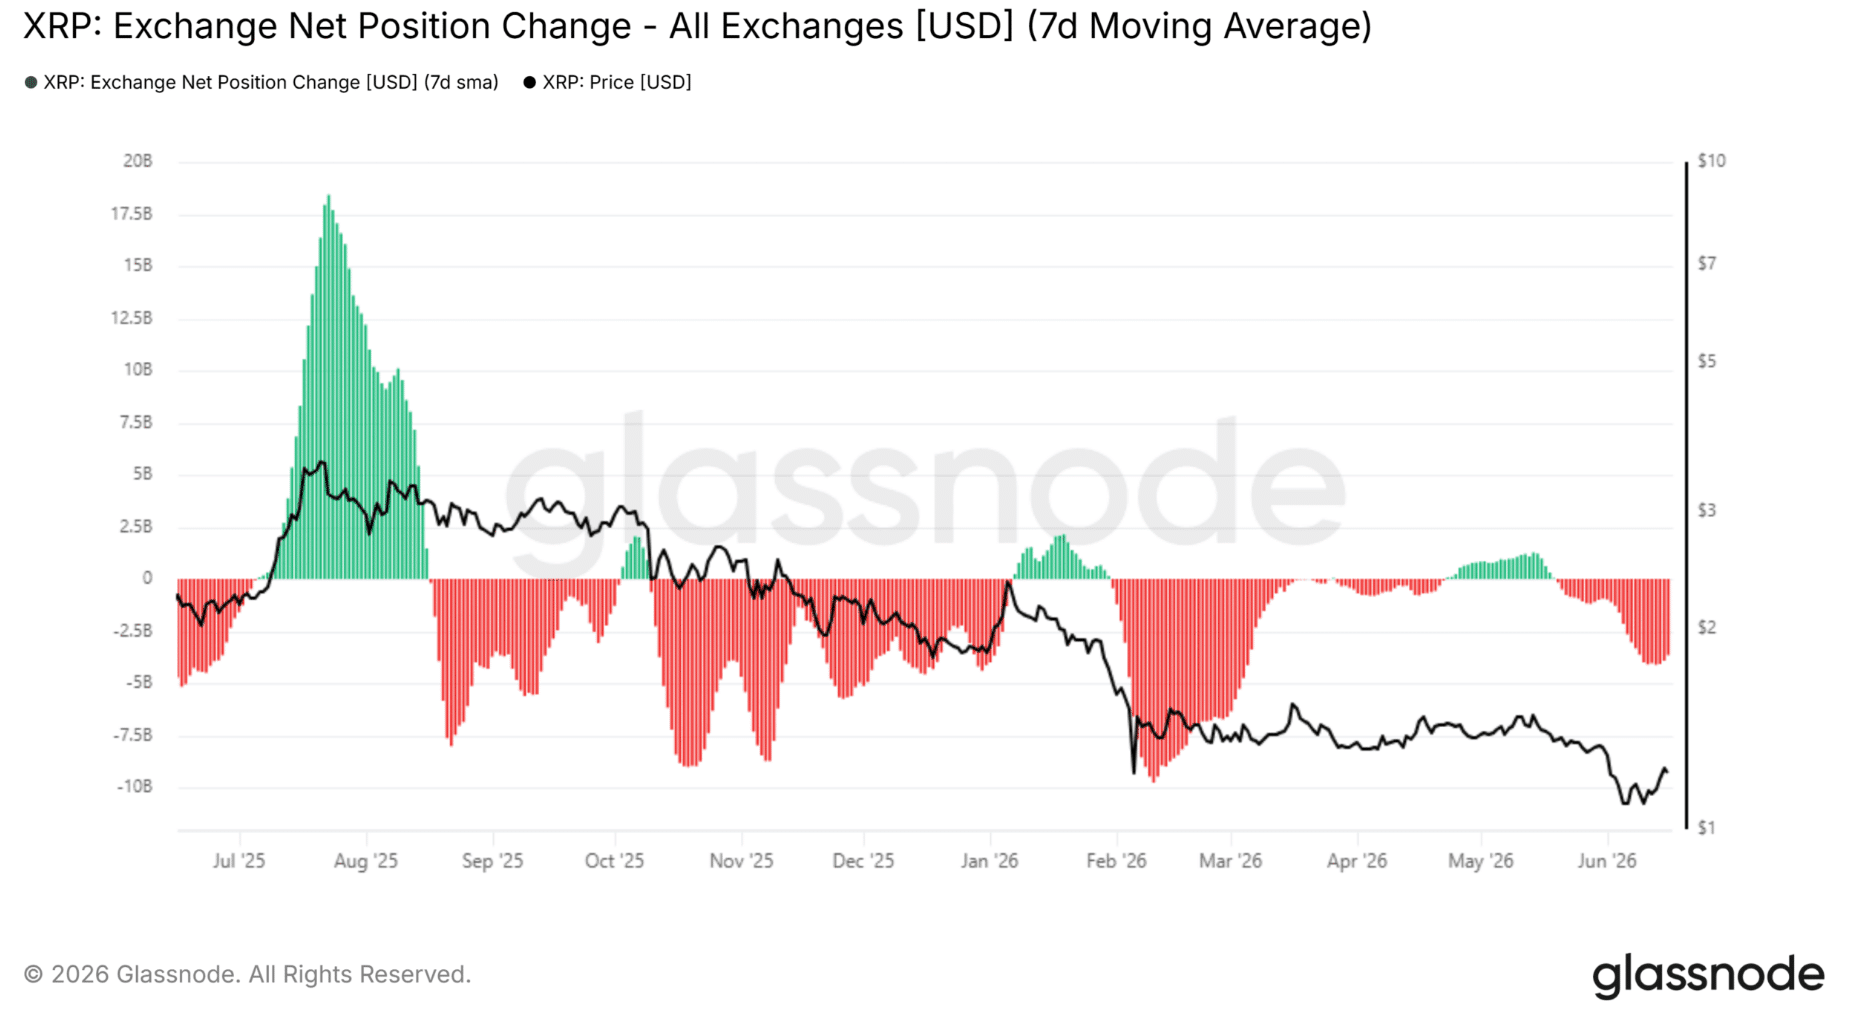
On-chain data adds another layer to the XRP price analysis. The 7-day moving average of the exchange net position change has been consistently negative over the past three weeks, meaning XRP has been leaving exchange wallets at a steady pace. Coins moving off exchanges typically suggest long-term holding intent, which sounds encouraging on paper.
The catch is that accumulation alone has not historically been enough to flip XRP’s price trend. Back in February 2026, a nearly identical wave of accumulation followed a massive sell-off, yet the price ranged sideways before continuing its descent rather than launching any recovery.
The Bearish Structure That Is Still Running the Show
Zooming out to the daily chart, XRP remains in a position that structurally favors sellers. The bounce from $1.14 managed to reach only the 50% retracement level of the prior decline before stalling and pulling back toward $1.21.
In trend analysis, a recovery that cannot reclaim even half of the previous drop is a sign of weakness rather than genuine momentum. Both the 50-day and 200-day simple moving averages are sitting above the current price, and trading below both simultaneously signals sustained bearish pressure across medium and long-term timeframes.
For traders watching the short-term XRP price analysis, the key levels are clear. A drop below $1.208 would reinforce bearish momentum and likely attract additional selling. Any bounce toward $1.35 to $1.44 is being treated as a potential distribution zone, where sellers can reload positions targeting a breakdown below $1.05 further along.
XRP Spot ETF Flows and the Bigger Picture
Spot XRP ETF flows have been largely positive through June, which stands out as one of the more encouraging signals within the broader XRP price analysis. Institutional interest through regulated vehicles carries real weight. That said, ETF inflows alone are unlikely to overpower a market structure that keeps printing lower highs, and when technical resistance is stacked above price, even institutional sentiment tends to act as a floor rather than a catalyst for sustained upside.
Conclusion
XRP hitting its $1.29 breakout target was a technically significant moment, but the rejection that followed was more revealing than the rally itself. Volume was thin, demand was geographically concentrated, and the bounce could not reclaim even half the prior decline. With the 78.6% Fibonacci level acting as a firm ceiling and key moving averages still well overhead, the XRP price analysis continues to lean bearish. Whether $1.21 holds in the coming days will be the first real test of whether buyers have enough conviction left to change that narrative.
Frequently Asked Questions FAQs
What is the current XRP price target according to analysts?
Based on the recent XRP price analysis, the immediate downside target sits below $1.05 if price breaks under $1.208, while any bounce toward $1.35 to $1.44 is considered a distribution zone for short-term traders.
What is a symmetrical triangle pattern in crypto trading?
A symmetrical triangle is a chart pattern where price makes a series of lower highs and higher lows, converging toward a point before a breakout. The breakout direction typically follows the prior trend, and in XRP’s case the prior trend was bearish, giving the pattern a downside bias by default.
Why does trading volume matter in XRP price analysis?
Volume confirms whether a price move has genuine participation behind it. A rally on declining volume suggests fewer traders are buying into the move, which makes the upside less reliable and more prone to reversal.
Glossary of Key Terms
Symmetrical Triangle: A converging chart pattern where lower highs and higher lows meet, typically resolving in the direction of the prior trend.
Fibonacci Retracement: A tool using percentage levels to identify potential support or resistance zones after a significant price move.
Exchange Net Position Change: An on-chain metric measuring whether cryptocurrency is flowing into or out of exchange wallets, used to assess accumulation or distribution behavior.
50-day and 200-day SMA: Simple Moving Averages over those periods, widely used to gauge medium and long-term trend direction.
Spot ETF: An exchange-traded fund holding the actual underlying asset rather than derivatives, giving institutional investors regulated exposure to the cryptocurrency.
Bearish Structure: A market condition where price consistently makes lower highs and lower lows, indicating sellers are in control of the prevailing trend.
Sources
glassnode
alicharts
Read More:XRP Hits Bullish Target Near $1.29 but Bears Are Already Lining Up for the Next Drop">XRP Hits Bullish Target Near $1.29 but Bears Are Already Lining Up for the Next Drop