XRP remains between established support and resistance as recent weakness keeps the broader recovery under pressure. Futures activity has picked up, while open interest has dipped, indicating
- XRP remains between established support and resistance as recent weakness keeps the broader recovery under pressure.
- Futures activity has picked up, while open interest has dipped, indicating participation in the current market pullback.
- Long liquidations dominate the 24-hour data, while exchange positioning remains mixed across major XRP derivatives venues.
XRP faces a series of key technical support and resistance levels, and recent selling pressure has put its recovery structure to the test. The market has moved from a period of long-term downtrend to consolidation.
XRP Tests Resistance After Recent Recovery
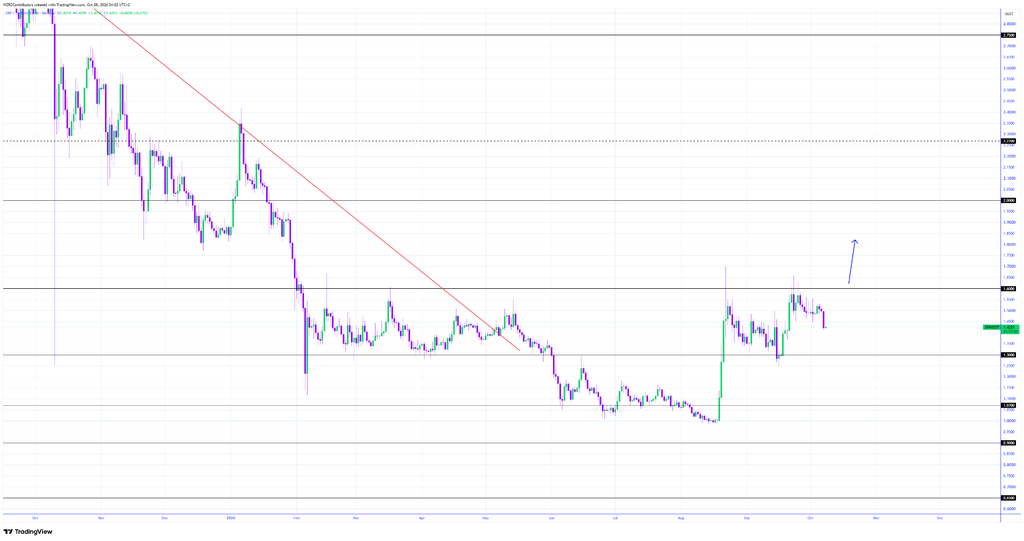
CRYPTOWZRD described the latest daily candle as bearish in the supplied technical outlook. The post noted rejection after price moved above the $1.4400 resistance level. It also identified $1.3000 as nearby support and $1.6000 as resistance.
Source:
X
The overall trend is down from above $2.50. Lower highs were pushed by a red descending trend line for most of the period shown. The structure eventually broke down as price levelled off to near the $1.00 level.
A sharp August recovery then lifted XRP toward the $1.50 region. Price moved through $1.30 before encountering renewed selling pressure. Since then, the market has developed a wider range between established technical boundaries.
The current price is about $1.4162, which is 2.53% lower in the period under consideration. Candles have recently been trading below $1.44, following a rally above the price. The failed recovery keeps the intermediate resistance zone relevant.
Support and Resistance Define the Current Range
The $1.30 level has become an important reference after several market reactions. Buyers previously appeared around this area during the broader consolidation. Its position now separates the current range from deeper support.
Above that zone, the market repeatedly encountered resistance near $1.50. The $1.60 level remains another major ceiling on the chart. Several advances toward those levels failed to produce sustained continuation.

The recovery from approximately $1.00 changed the market's recent trading structure. XRP stopped producing the persistent lower lows seen earlier. However, the price remains below the stronger resistance that could confirm further structural improvement.
The latest decline has returned attention toward the middle of the range. A sustained hold above $1.30 would preserve the higher trading area. Conversely, renewed weakness could bring the lower support region back into focus.
Derivatives Data Shows Rising Market Activity
The derivatives dashboard records approximately $3.94 billion in futures volume. That figure increased 10.34%, while open interest declined 1.44% to $3.32 billion. The combination points to active turnover alongside some reduction in outstanding positions.

Source:
Coinglass
Options volume fell 39.68% to approximately $3.29 billion. Meanwhile, options open interest increased 1.08% to about $69.87 million. These figures show contrasting changes across different derivatives measures.
The overall 24-hour long-short ratio stands near 0.8997. Exchange-level ratios differ, with Binance XRP/USDT near 2.54 and OKX around 3.19. Top-trader ratios also remain above one across the displayed Binance measures.
Liquidations provide a clearer view of recent downside pressure. Twenty-four-hour liquidations total approximately $14.16 million, with longs accounting for $13.69 million. Twelve-hour liquidations reached $5.03 million, including $4.78 million from long positions.
Overall, the chart shows a recovery that remains contained by established resistance. The bearish daily close adds pressure after the failed move above $1.44. Meanwhile, strong futures activity and heavy long liquidations accompany the latest decline.