Key Highlights XRP trading at $1.33 (+2.32%) — inverse H&S forming on daily chart with right shoulder at $1.25 support per @alicharts HYPE at $81.26 testing rising trendline for third time —
Key Highlights
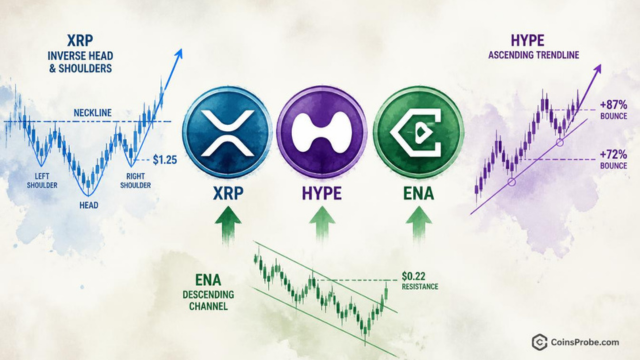
XRP trading at $1.33 (+2.32%) — inverse H&S forming on daily chart with right shoulder at $1.25 support per @alicharts
HYPE at $81.26 testing rising trendline for third time — prior two touches produced +87.17% and +72.16% rallies
ENA up 18% in days, testing descending channel upper boundary at $0.22 — breakout targets $0.24 then $0.27
All three setups unconfirmed — FOMC outcome is the immediate macro catalyst that could resolve each pattern
With the Federal Open Market Committee meeting approaching, three altcoins are at technically critical junctures. XRP is trading at $1.33 — up 2.32% in the past 24 hours — with a market cap of approximately $84.1 billion and $1.53 billion in 24-hour volume. Hyperliquid (HYPE) is bouncing from a rising trendline near $81. Ethena (ENA) is testing the upper boundary of a descending channel at $0.21. All three are at levels that will define near-term trajectory — and chart analyst Ali Martinez (@alicharts) has mapped exactly what needs to happen at each.
In a five-part thread published on October 27, 2026 and titled “Altcoins Bounce Ahead of the FOMC,” Martinez lays out the decision points for XRP, HYPE, and ENA with surgical precision — identifying key support levels, pattern structures, and the specific price that separates a continuation from a breakdown. The timing matters: FOMC meetings historically inject directional volatility into risk assets, and altcoins with defined technical structures tend to resolve sharply in either direction.
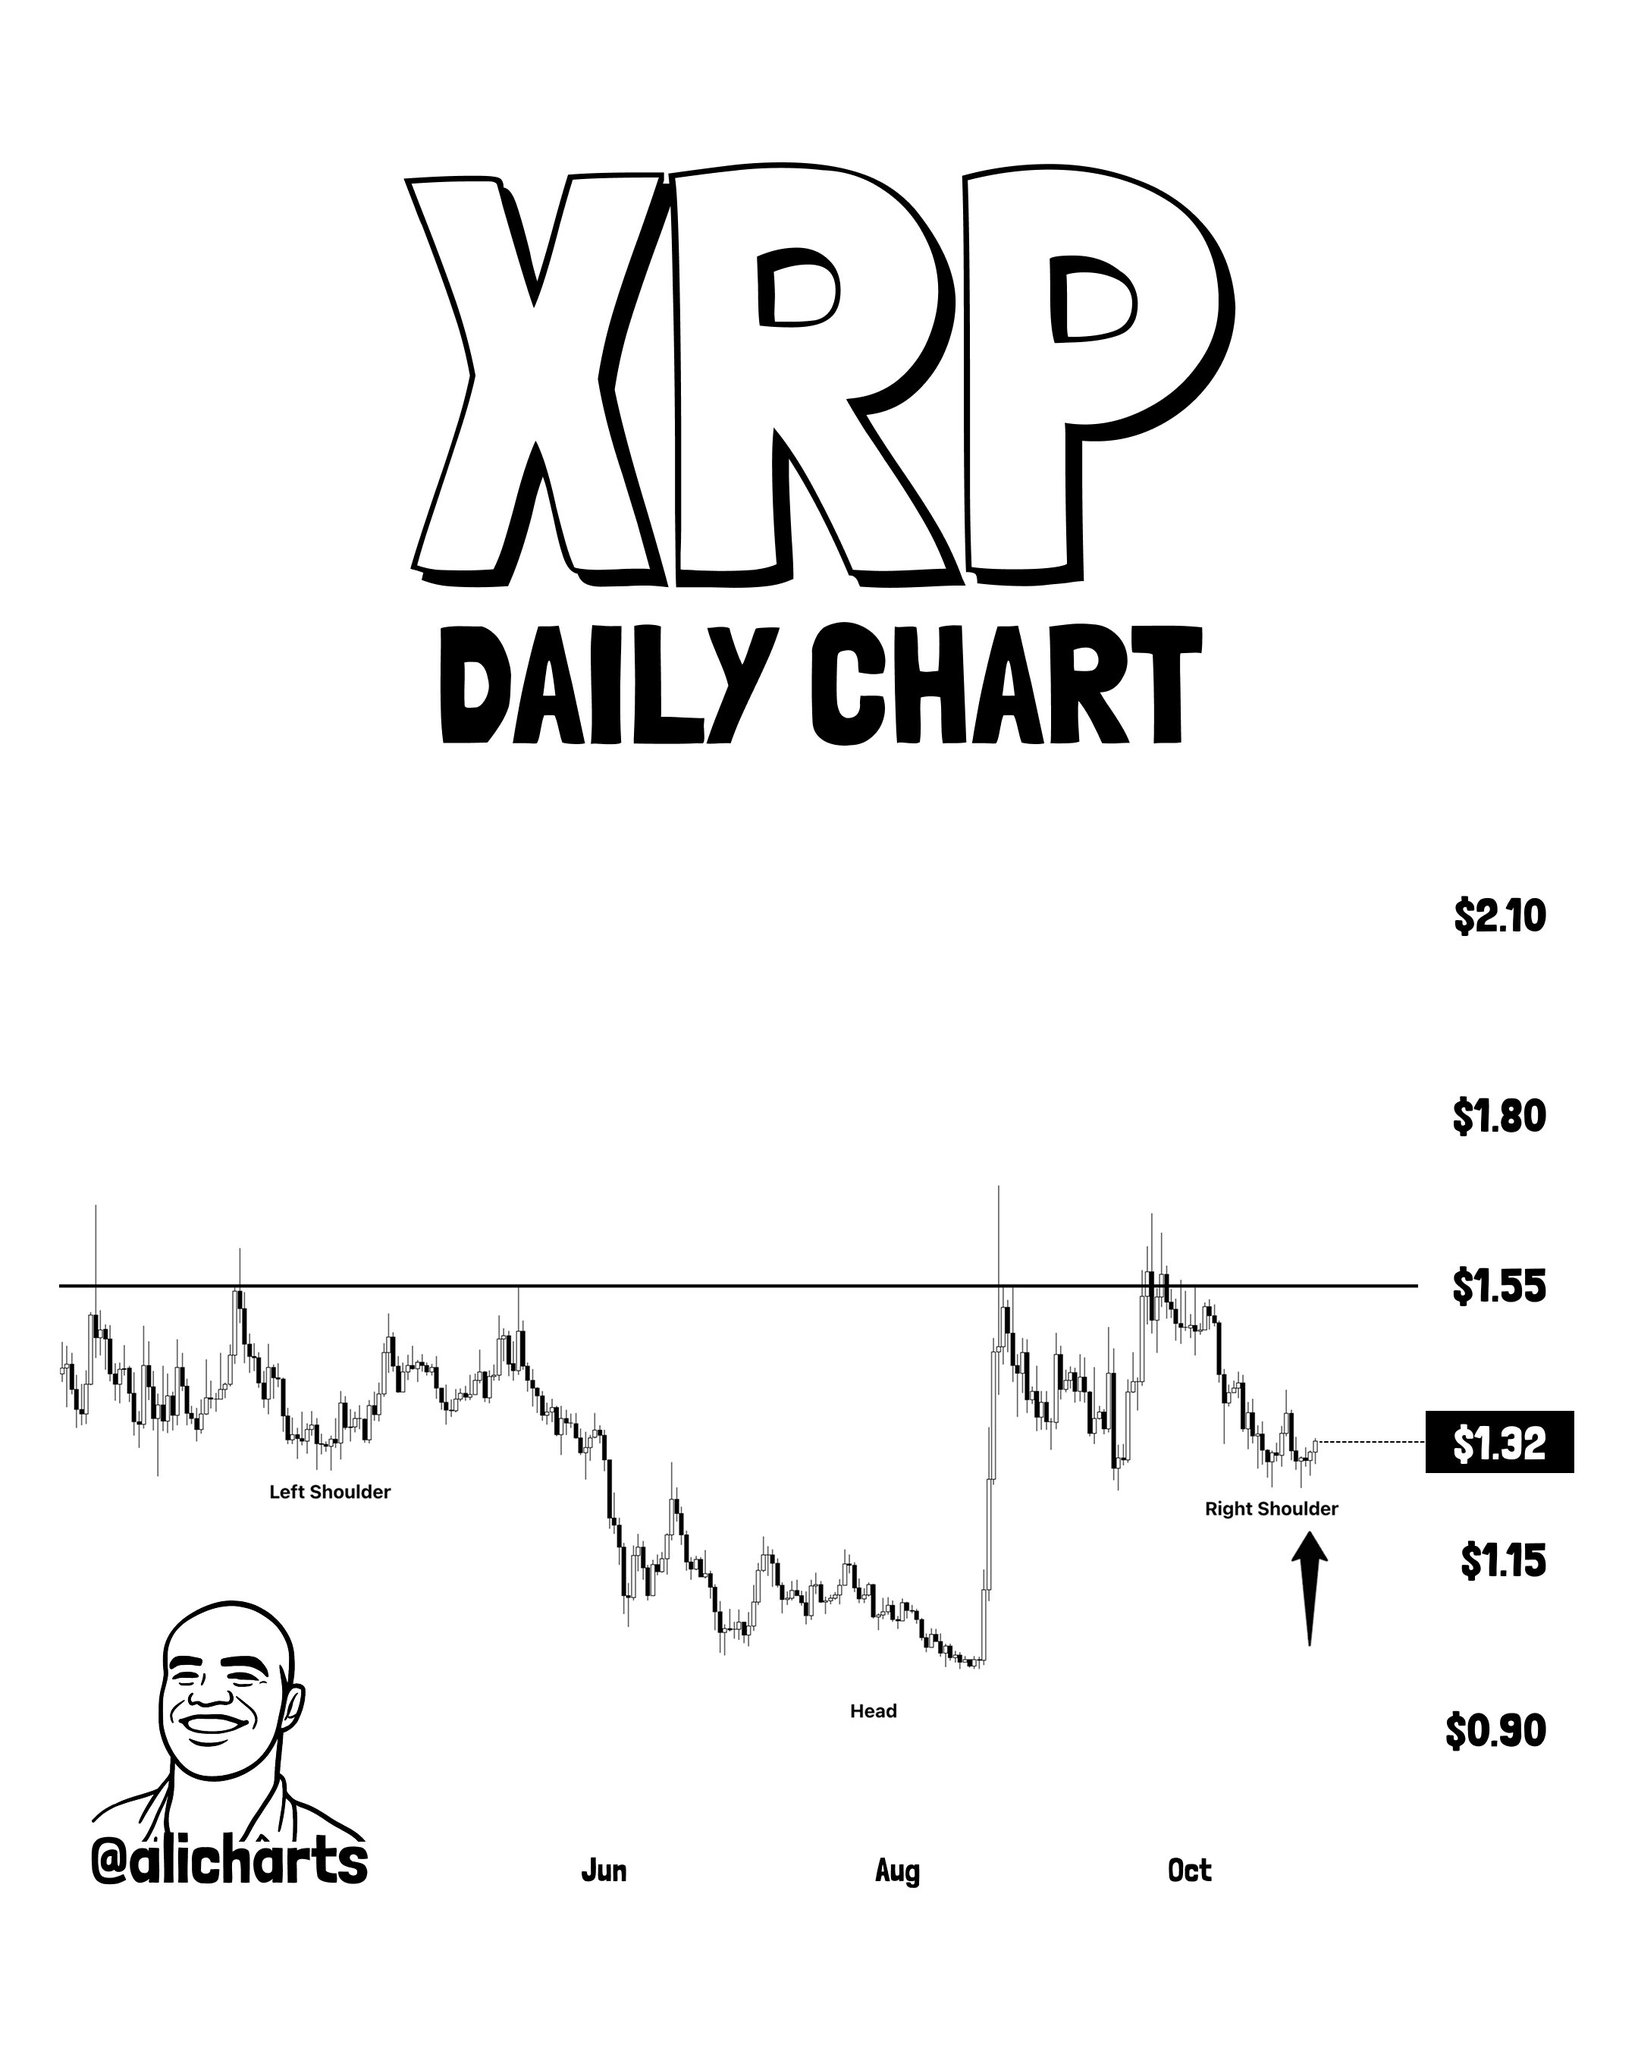
On the daily chart, Martinez identifies an inverse head-and-shoulders bottom forming in XRP. The pattern’s structure — left shoulder, a deeper middle low (the head), and a developing right shoulder — places the current right shoulder near the $1.25 support level. At time of writing, XRP is trading at $1.33, which sits above that $1.25 support but still below the neckline at $1.55. The chart marks the current price at $1.32 relative to the pattern’s key levels of $0.90, $1.15, $1.32, $1.55, $1.80, and $2.10.
XRP Daily Chart | Source: @alicharts (X)
The inverse head-and-shoulders is a reversal pattern — it signals that sellers have exhausted a downtrend and buyers are beginning to establish a higher low. In this case, the right shoulder’s hold at $1.25 is not merely a support test; it is the structural condition required for the pattern to remain valid. Martinez states clearly: if $1.25 holds, XRP could move toward the neckline at $1.55. A daily close above $1.55 would technically confirm the pattern, with a measured breakout target at $2.10. If $1.25 fails, Martinez flags the next significant level at $0.98.
The pattern is still forming — no neckline breakout has occurred. XRP’s position at $1.33 means it has recovered from the right shoulder zone but has not yet tested the $1.55 neckline. The critical near-term question is whether the FOMC catalyst drives enough momentum to push a daily close above $1.55, or whether macro uncertainty sends XRP back to retest $1.25.
Bullish Scenario
$1.25 holds as the right shoulder base → XRP advances to test the $1.55 neckline → a confirmed daily close above $1.55 opens the measured move target of $2.10.
Bearish Scenario
A daily close below $1.25 invalidates the inverse head-and-shoulders structure → next meaningful support at $0.98.
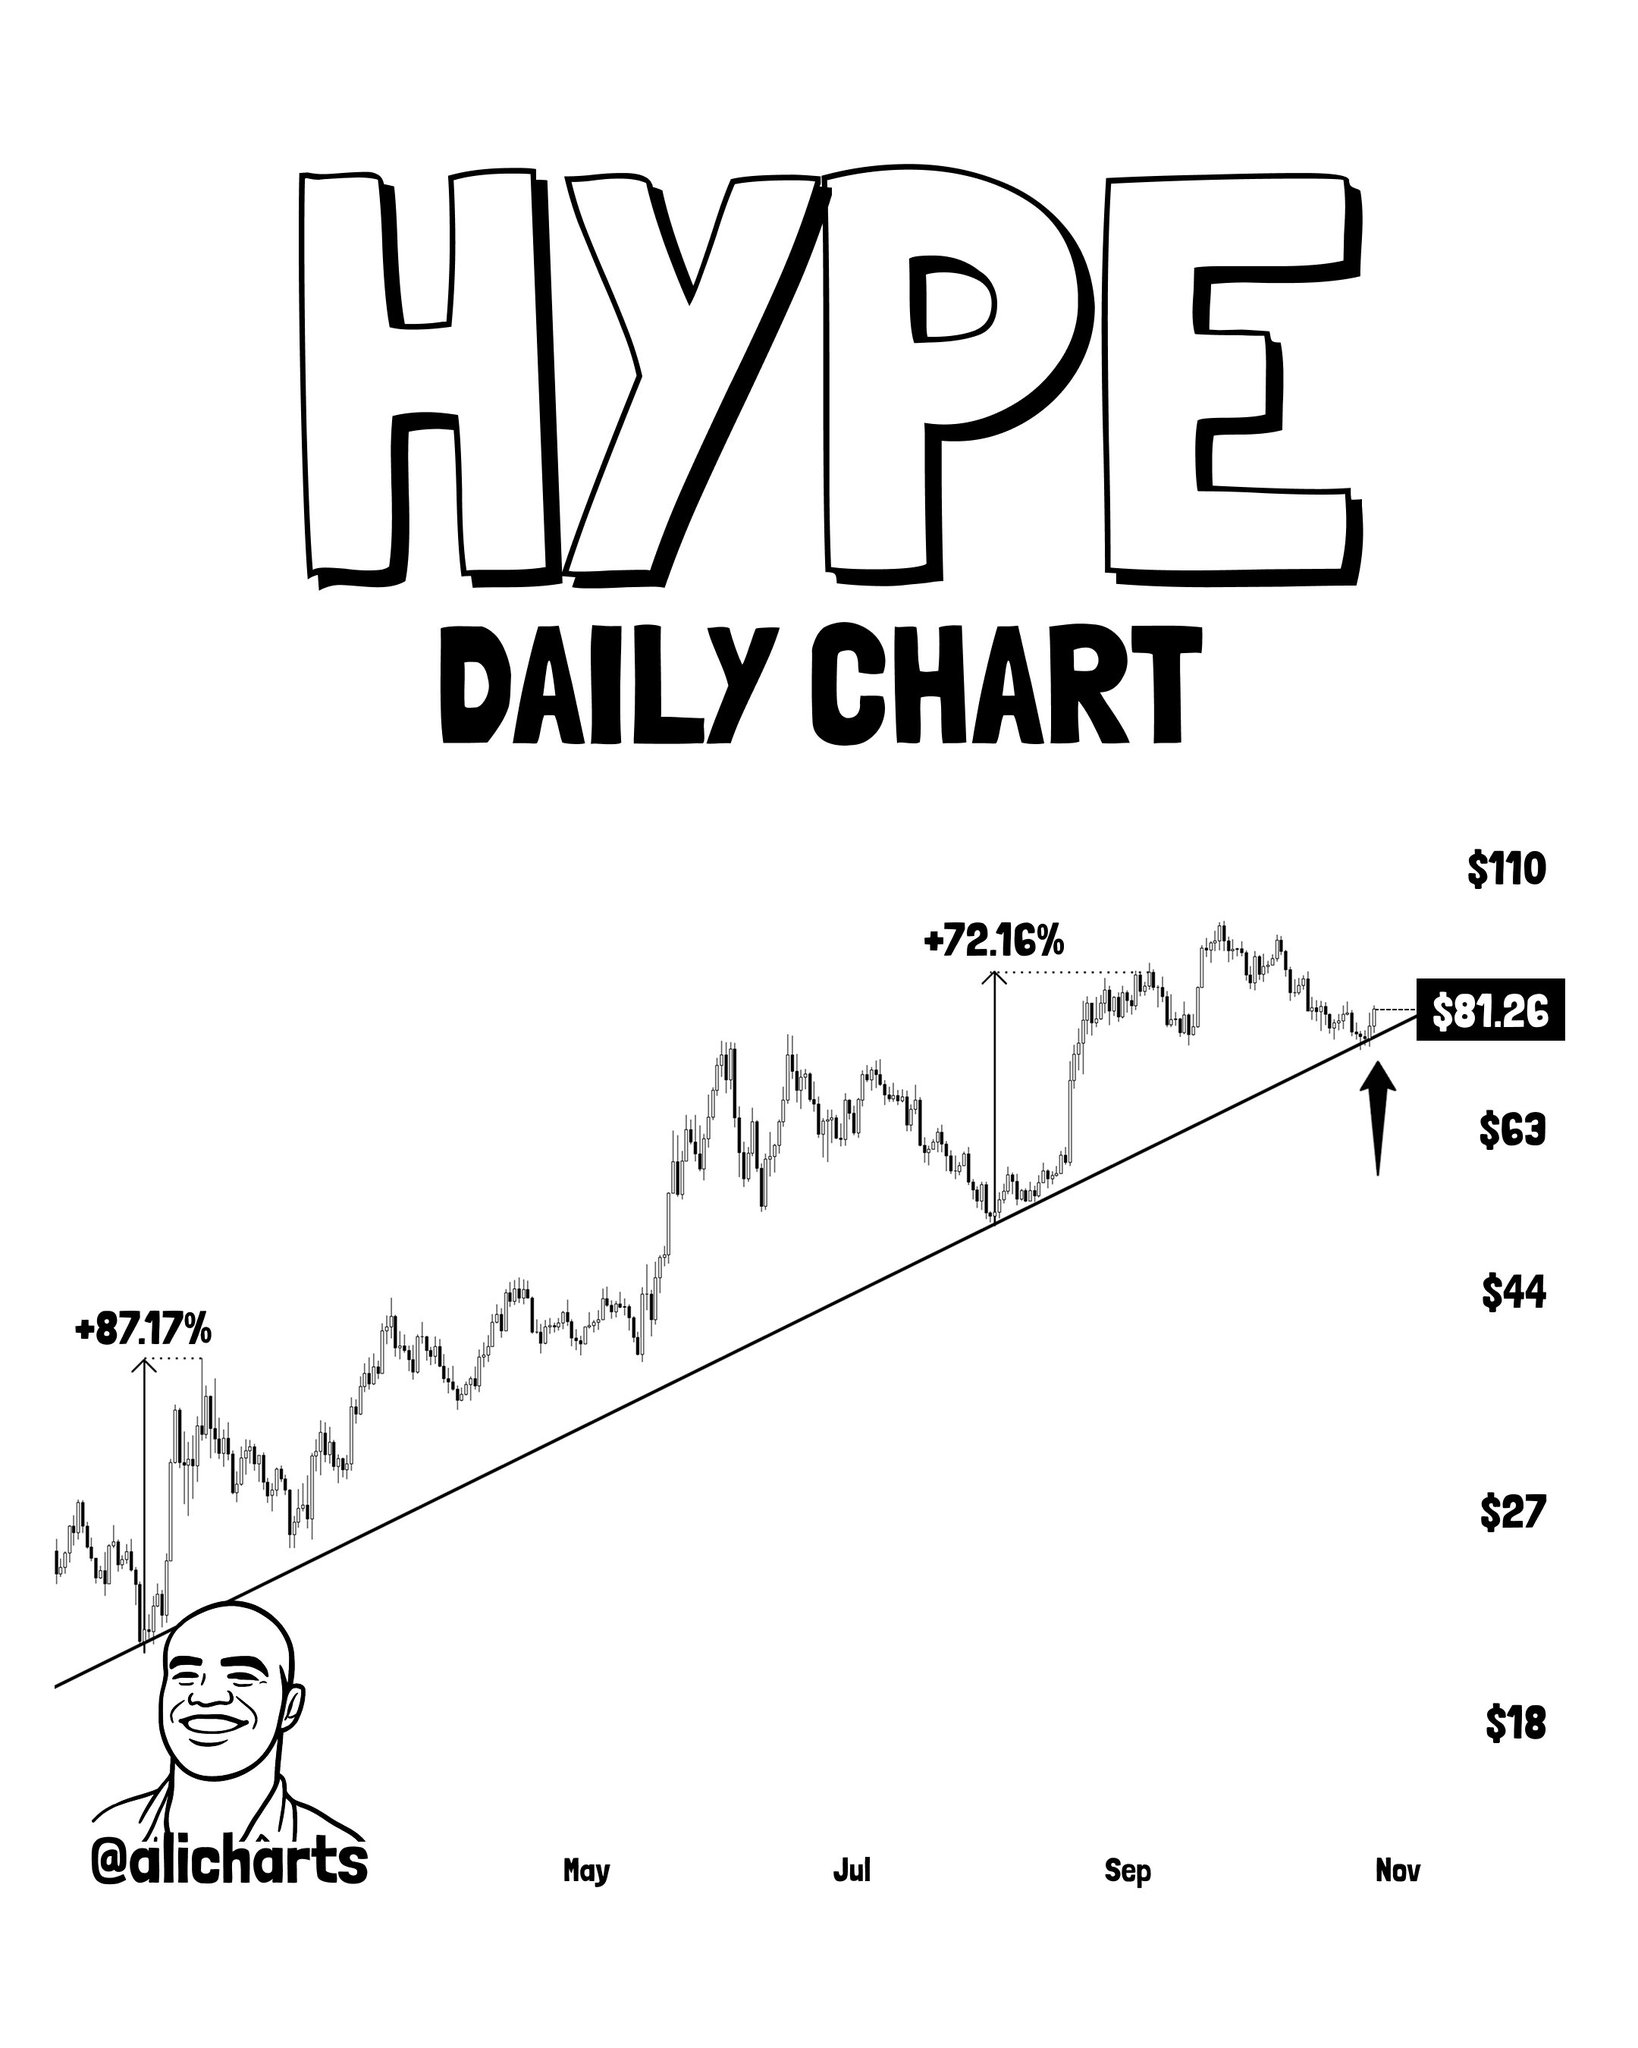
Hyperliquid has bounced from approximately $74, a level coinciding with a rising trendline in place since late January 2026. Martinez notes that this trendline has now been tested three times — and the two prior touches produced documented rallies of +87.17% and +72.16% respectively. The current price of $81.26 sits precisely at the trendline, with an upward arrow on the chart signaling that Martinez views this as a potential third bounce setup.
HYPE Daily Chart | Source: @alicharts (X)
The chart displays price labels at $18, $27, $44, $63, $81.26, and $110 — the latter being the identified target if the trendline holds. The two prior percentage moves are annotated directly on the chart: the first bounce from the early May region (+87.17%) and the second from the July region (+72.16%). Both are completed historical moves, not projections. The current setup is structurally analogous — a third touch at rising support — but the pattern remains unconfirmed until price sustains above the trendline and clears recent highs.
Martinez sets the upside target at $110 if the trendline holds. If it breaks, the next meaningful downside levels are $67 and then $60. Given the prior two instances each produced rallies exceeding 70%, the trendline’s track record is the core of the setup — but past performance at this support does not guarantee the third instance follows the same path. The FOMC outcome is an immediate macro variable that could determine whether this third test holds or breaks.
Altcoin momentum strategies with defined trendlines are explored further in CoinsProbe’s coverage of AI Agent Altcoins Losing Momentum — VVV, TRAC, and ARC Face Key Breakdown Levels, where similar trendline break scenarios are mapped.
Bullish Scenario
Rising trendline holds at $74–$81 → HYPE advances toward $110, following the pattern established by the prior +87% and +72% bounces.
Bearish Scenario
A sustained break below the rising trendline → $67 becomes the first downside target, followed by $60.
Ethena has gained +18% over the past few days, per Martinez’s thread, pushing price to test the upper boundary of a descending parallel channel on the 4-hour chart. The current price is marked at $0.210, pressing directly against the channel’s upper trendline — the same boundary that has capped rallies throughout the pattern’s duration. The chart spans from approximately the 10th through the 28th, with key price levels at $0.15, $0.18, and $0.21.
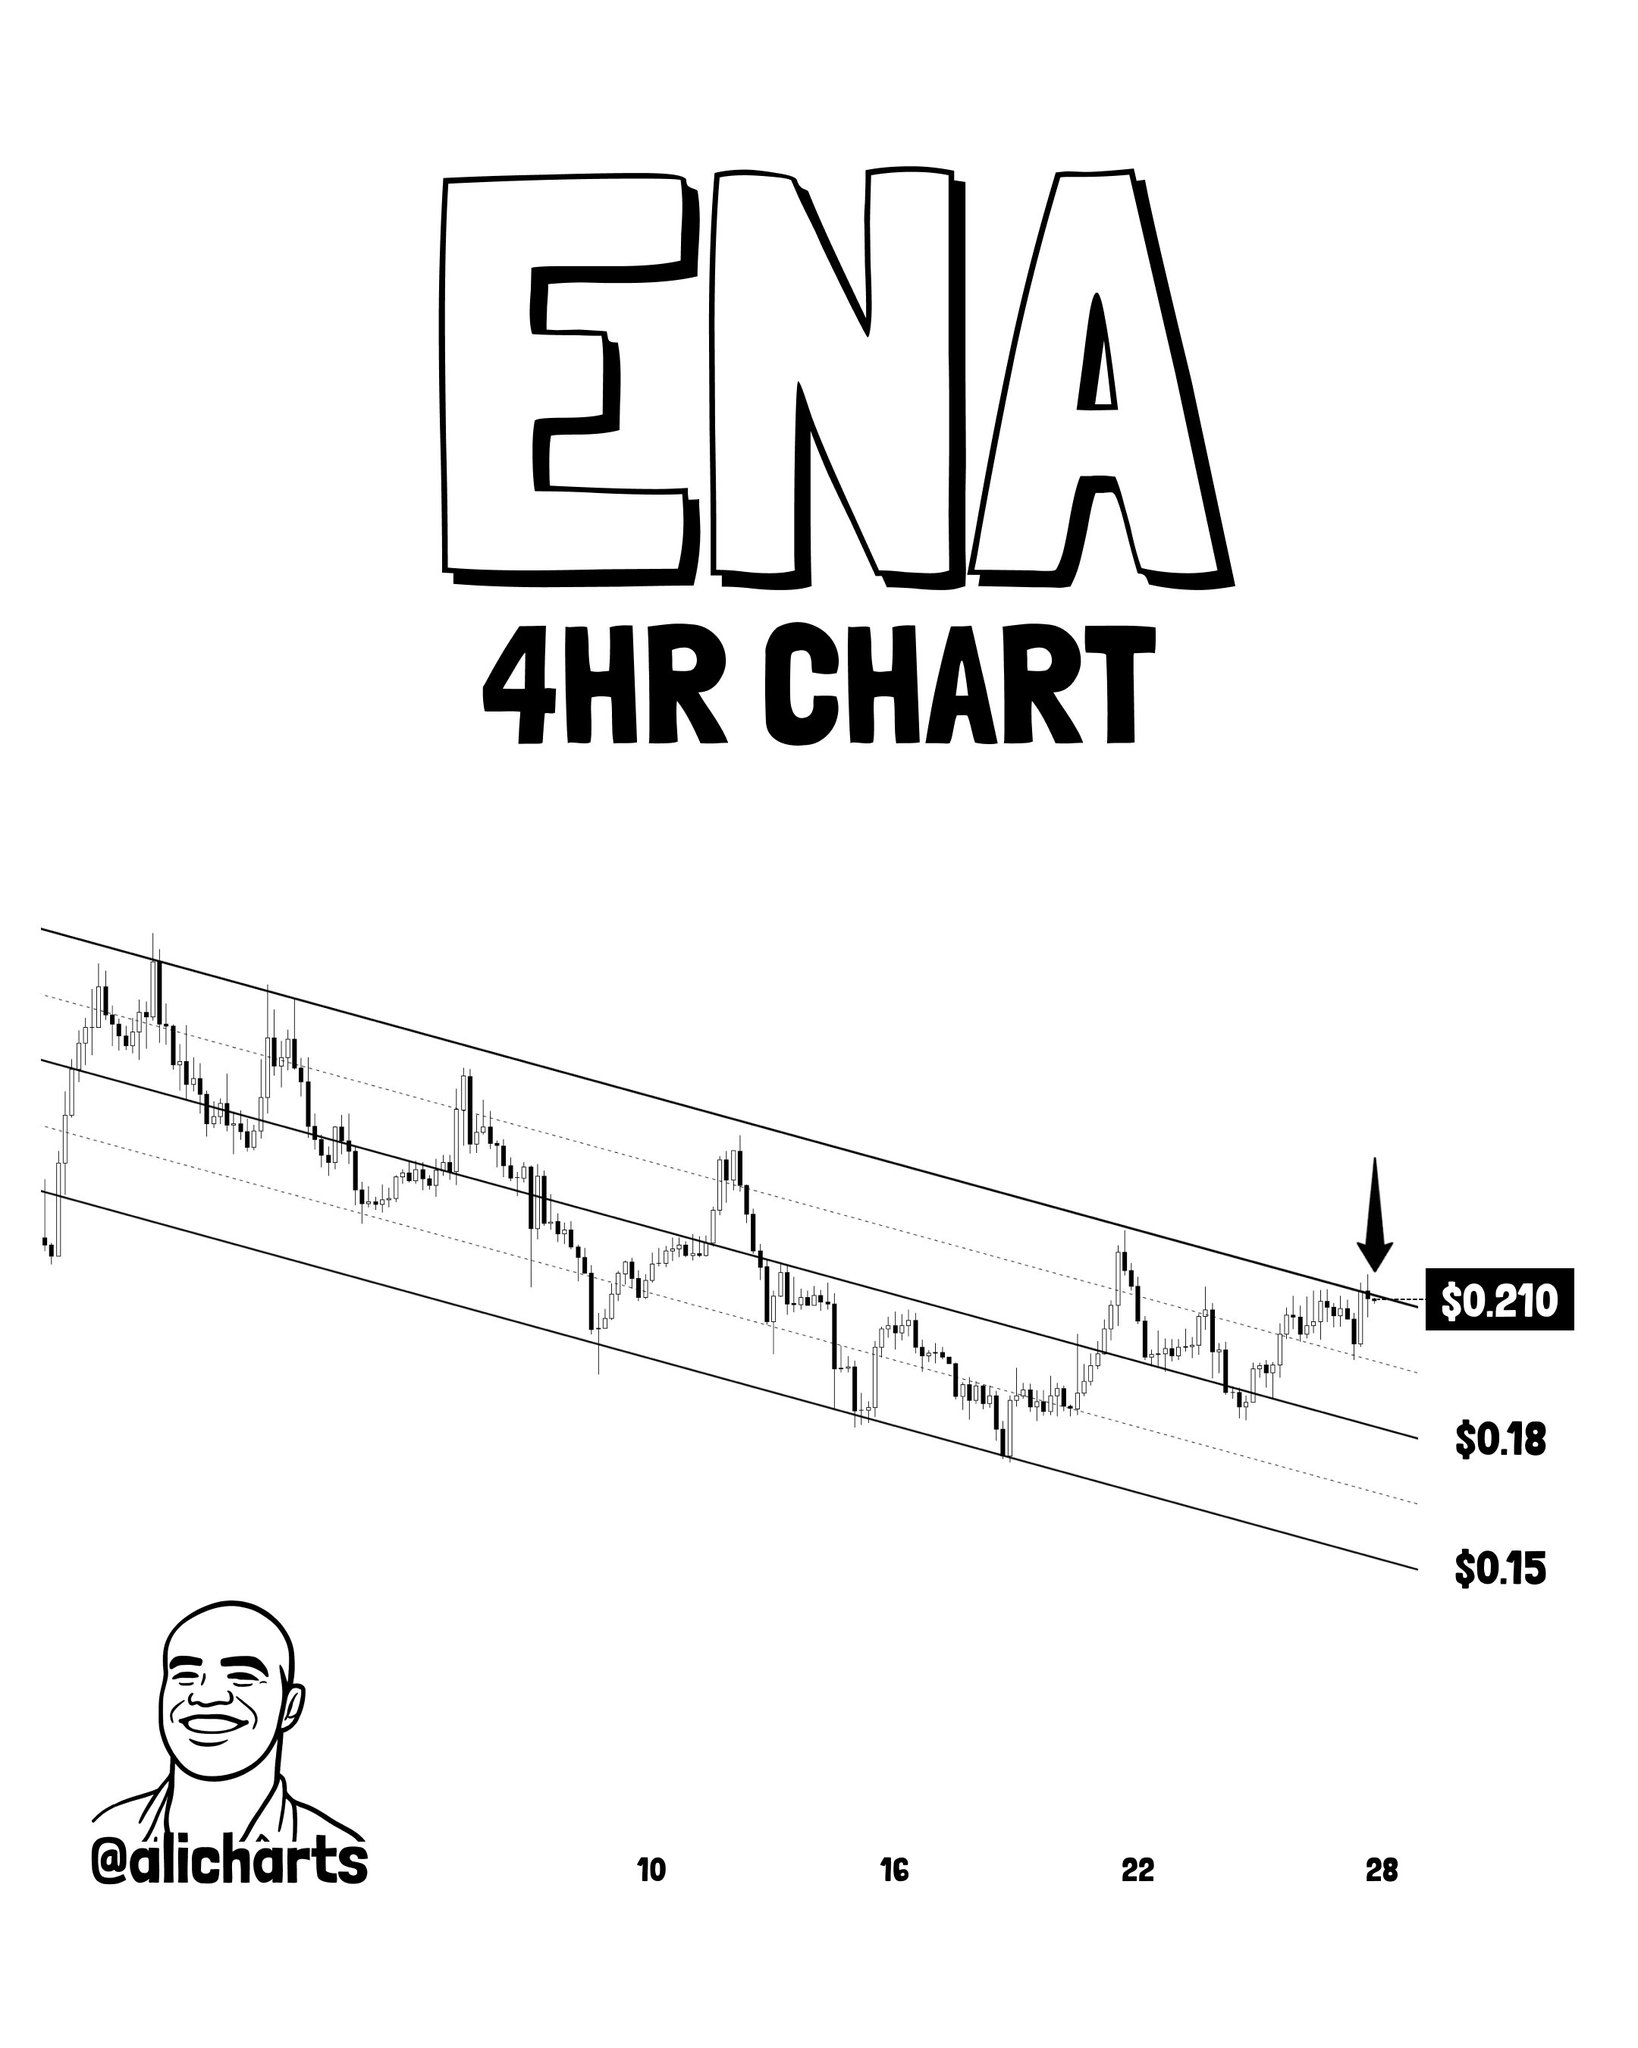
ENA 4H Chart | Source: @alicharts (X)
A descending channel is defined by two parallel downward-sloping trendlines — the upper acting as resistance, the lower as support. Price oscillating between them is range-bound, bearish in structure until a confirmed break above the upper boundary. Martinez’s analysis identifies $0.22 as the specific level requiring a break for bullish confirmation — meaning the pattern is not resolved at $0.210. The 18% gain has brought ENA to the decision point, not through it.
If ENA closes above $0.22 on the 4-hour chart, Martinez flags the next targets at $0.24 and then $0.27. A failure to break — meaning price gets rejected at the upper boundary — returns the mid-channel level of $0.18 as the near-term downside. The pattern remains forming: ENA is at a critical inflection, not a confirmed breakout. The FOMC catalyst could provide the volatility needed to resolve this channel definitively in one direction.
Bullish Scenario
4-hour close above $0.22 confirms the channel breakout → targets at $0.24 and $0.27 open progressively.
Bearish Scenario
Rejection at the $0.22 upper channel boundary → price returns to mid-channel support at $0.18.
Martinez frames all three setups explicitly in the context of the approaching FOMC decision. All three patterns share a common structural feature: they are at decision points where either a macro tailwind or headwind will force resolution. Risk-on FOMC outcomes — rate cuts or dovish signals — have historically provided the directional liquidity needed to clear resistance levels that have resisted organic buying. Risk-off outcomes — hawkish surprises or no-cut reaffirmations — tend to break supports that were holding on sentiment alone.
For XRP at $1.33, the question is whether FOMC-driven momentum can push a daily close above $1.55. For HYPE at $81.26, whether it can sustain the trendline while navigating macro uncertainty. For ENA, whether the 18% pre-FOMC move has enough follow-through to close the 4-hour bar above $0.22. None of these are confirmed. All three are live. Macro context — including the FOMC rate outlook — remains a key variable, with Bitcoin market dynamics adding additional macro overlay as covered in Bitcoin Trader Realized Price Rising Again — Dynamic Support in Bull Corrections.
Martinez’s thread is a structured pre-FOMC watchlist — not a prediction. The analyst identifies the levels that matter and lets the market answer. Watch $1.25 and $1.55 for XRP, $74 and $110 for HYPE, and $0.22 and $0.18 for ENA as the levels that will define whether these setups resolve bullishly or fail into the next leg lower.
Disclaimer: The views and analysis presented in this article are for informational purposes only and reflect the author’s perspective, not financial advice. Technical patterns and indicators discussed are subject to market volatility and may or may not yield the anticipated results. Investors are advised to exercise caution, conduct independent research, and make decisions aligned with their individual risk tolerance.
Also Read: Bitcoin OI Hits 36.7% in 2026 — Already Above the 6-Year Median