XRP has spent months moving lower after failing to hold above its recent highs. That pullback has made many investors focus on short term weakness. A much bigger picture, however, tells a ver
XRP has spent months moving lower after failing to hold above its recent highs. That pullback has made many investors focus on short term weakness. A much bigger picture, however, tells a very different story. One analyst believes Ripple’s native token may be repeating the same macro structure that came before two massive rallies.
Crypto Patel recently shared a long-term XRP chart that compares the current cycle with the previous two. His analysis points to a familiar accumulation phase that eventually led to gains of more than 1,000%. History does not guarantee another repeat. Even so, the similarities have become difficult to ignore.
Crypto Patel Believes XRP Has Returned to Another Long Term Accumulation Zone
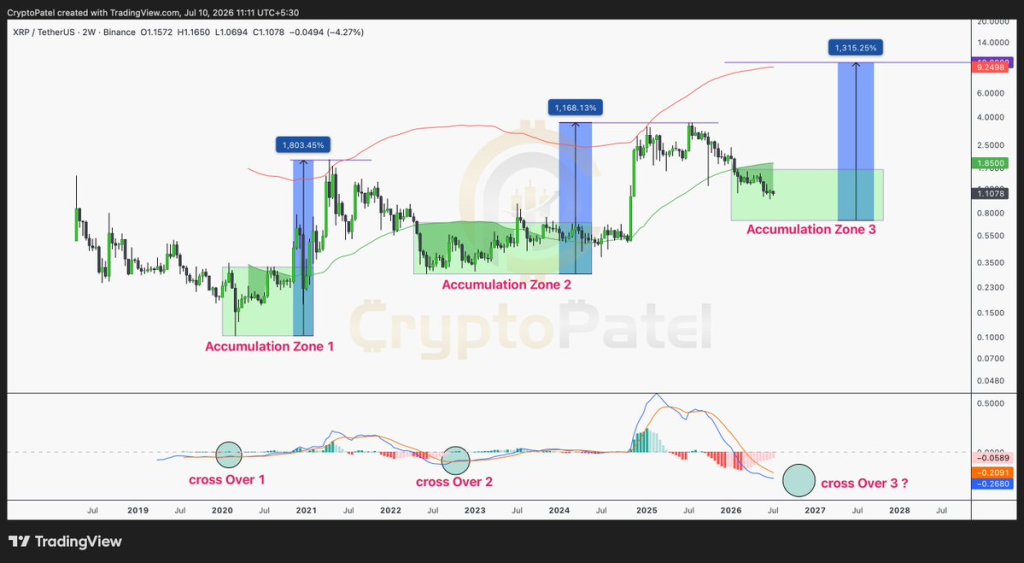
Crypto Patel’s chart uses the 2-week XRP timeframe to compare three major market cycles.
Each cycle begins with a long accumulation period where XRP trades inside a wide range before finally breaking higher. The first accumulation zone eventually led to a rally of about 1,803%. The second produced another move of roughly 1,168%.
The current market now appears to be entering what the analyst calls “Accumulation Zone 3.”
The highlighted demand area stretches from about $1.10 down to $0.70. Crypto Patel believes this has acted as a major support region during previous cycles. His chart also places major resistance around the $3 level. A successful move above that barrier could open the door to much higher prices if the historical pattern continues.
Another detail comes from the MACD indicator beneath the price chart. Previous bullish crossovers appeared close to the end of each accumulation period. The current MACD looks close to another possible crossover. That setup forms an important part of the analyst’s bullish outlook.
Based on those similarities, Crypto Patel believes XRP could eventually target prices above $9 if support remains intact and resistance finally breaks.
XRP Price Could Still Drop Before Any Large Rally Begins
The long term setup does not rule out more downside first. Crypto Patel’s chart shows XRP trading close to $1.10 today. The wider structure still leaves room for another decline before a new expansion phase begins.
@CryptoPatel / X
Looking at the same chart, the lower boundary of the long-term pattern sits close to the $0.50 to $0.60 area. XRP has reached similar levels during previous market cycles before finding strong demand. Those lows eventually became the foundation for much larger advances.
That possibility means a deeper correction would not automatically invalidate the broader pattern. Previous cycles followed a similar path. Price spent months testing support before buyers regained control.
Anyone following this setup should remember that macro patterns often take many months to develop. Daily price swings rarely change the bigger picture on their own.
Read Also: Could XRP and XLM Replace Bitcoin? Catherine Austin Fitts Makes a Bold Prediction
Previous XRP Cycles Show Why Patience Can Matter
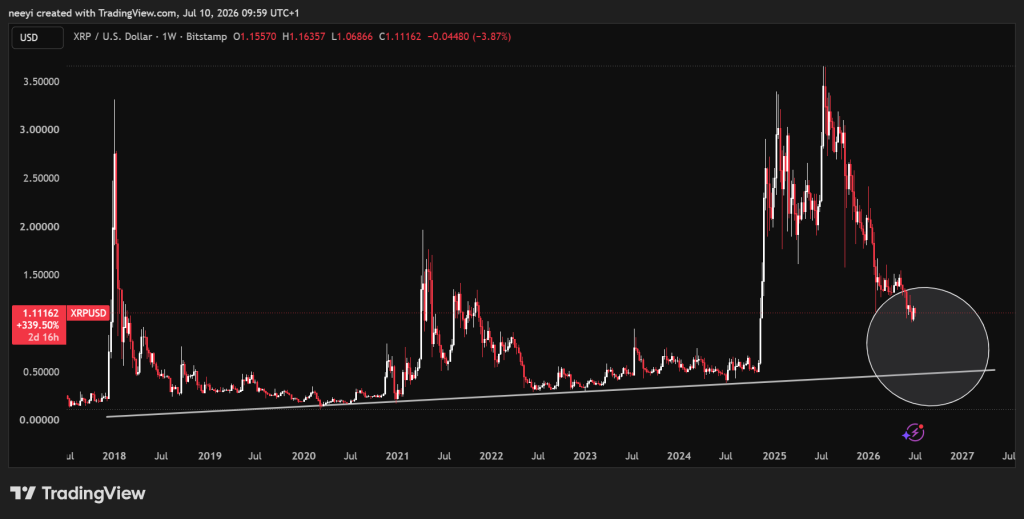
The chart also reveals another interesting pattern.
Each accumulation phase lasted much longer than the rally that followed. XRP spent extended periods moving sideways before finally breaking above resistance.
XRP Price Chart / TradingView.com
That behavior explains why many long term technical analysts focus more on support zones than short term price movements. Extended consolidation has appeared before every major advance shown on Crypto Patel’s chart.
Another important observation comes from the projected path on the chart. Even if XRP revisits the $0.50 to $0.60 region, the overall structure could remain consistent with previous cycles. That area has acted as a launching point before, although there is no guarantee history will repeat exactly.
Markets rarely move in straight lines. XRP may continue testing support before the next major move becomes clear.
FAQs
Will XRP reach $500 dollars?XRP reaching $500 is considered virtually impossible under current economic realities, as it would require a market capitalization of over $30 trillion. This figure is larger than the combined market value of all gold ever mined and roughly eight times the size of the entire cryptocurrency market at its peak
Will XRP be as big as Bitcoin?It is highly improbable that XRP will ever reach Bitcoin’s size in total market capitalization, as Bitcoin is firmly established as a dominant store of value with a trillion-dollar valuation. XRP is currently a much smaller asset designed primarily to facilitate global banking and institutional payments
Subscribe to our YouTube channel for daily crypto updates, market insights, and expert analysis.
The post XRP Is Now Showing a Familiar 10x Pattern: Here’s How It Could Happen appeared first on CaptainAltcoin.