Key Takeaways XRP fell to $1.0405, with today’s low of $1.0116 the weakest since June 5. All three moving averages are declining and stacked well above price. Glassnode’s 90-day Realized P/L
Key Takeaways
- XRP fell to $1.0405, with today’s low of $1.0116 the weakest since June 5.
- All three moving averages are declining and stacked well above price.
- Glassnode’s 90-day Realized P/L ratio hit 0.33, its lowest since August 2022.
- The reading signals a deepening capitulation, not a confirmed bottom.
The price is pressing toward the psychologically important $1.00 line, and the on-chain data underneath suggests the selling is structural rather than a brief flush.
The Technical Snapshot
The daily chart is firmly bearish. All three moving averages are declining and stacked well above price, the 50-day at $1.2675, the 100-day at $1.3265, and the 200-day at $1.5240, leaving no nearby support from any of them. RSI at 30.74 sits right at the edge of oversold territory.
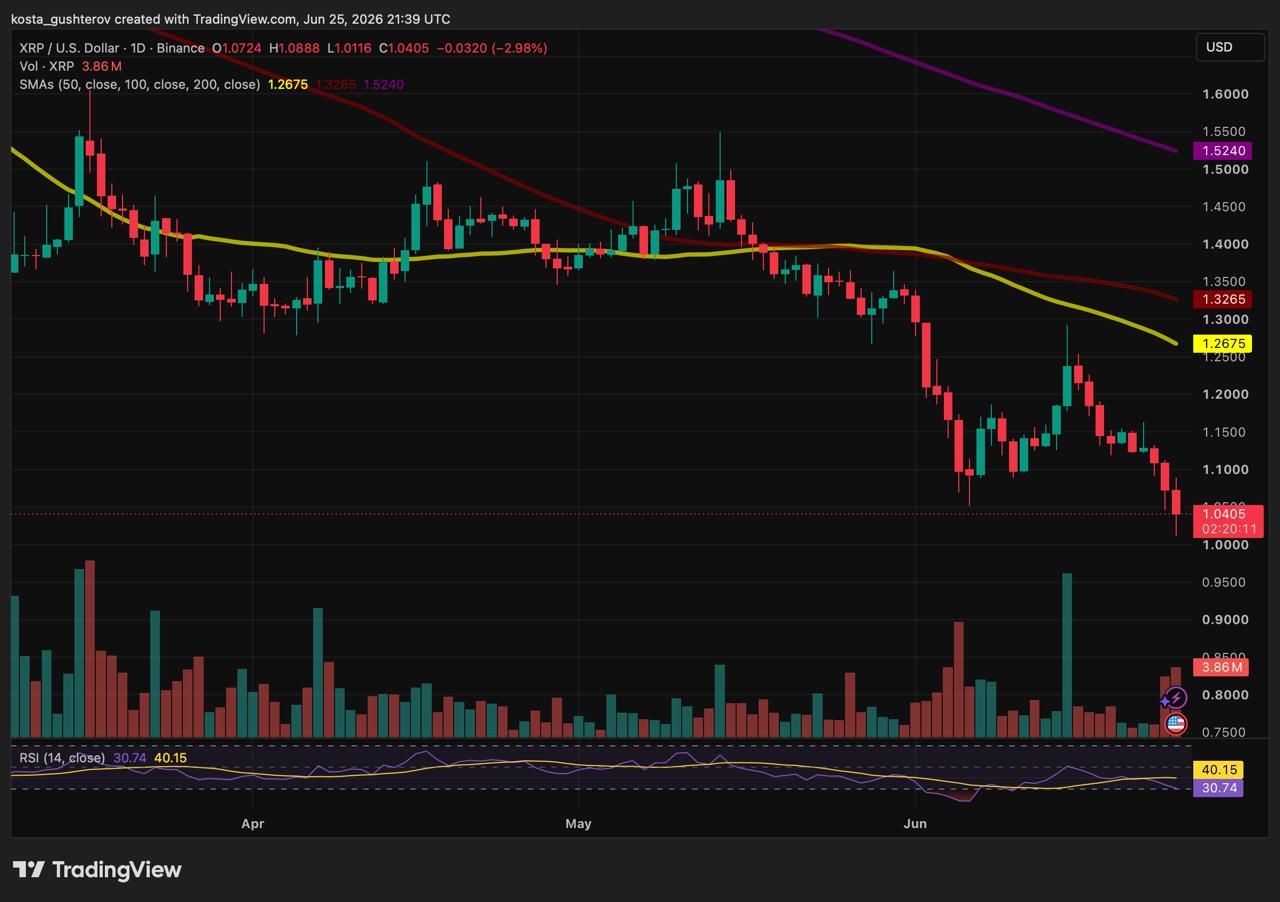
In plain terms, an RSI near 30 means the recent selling has been intense enough that the asset may be due for a pause or a small bounce as sellers run out of steam, though oversold alone doesn’t guarantee a reversal. One sign of life: volume at 3.86M is the highest green bar on the visible chart, which suggests the bounce off today’s low had some real participation behind it.
LevelZoneSignificanceResistance$1.10-$1.12Last week’s consolidation zone before the breakdownResistance$1.20 / $1.27Higher levels; $1.27 aligns with the 50-day averageSupport$1.01-$1.03Today’s low zone, currently being testedSupport$1.00Psychological floor; little structural support below it
The On-Chain Reality
The chart shows the price; Glassnode’s data shows the behavior, and it’s the more sobering of the two. The Realized Profit/Loss Ratio’s 90-day moving average has dropped to 0.33, the lowest reading since August 2022. That ratio measures how much profit is being realized on-chain versus loss. When it’s below 1, losses dominate, and at 0.33, losses are overwhelming profits by roughly three to one on a smoothed 90-day basis.
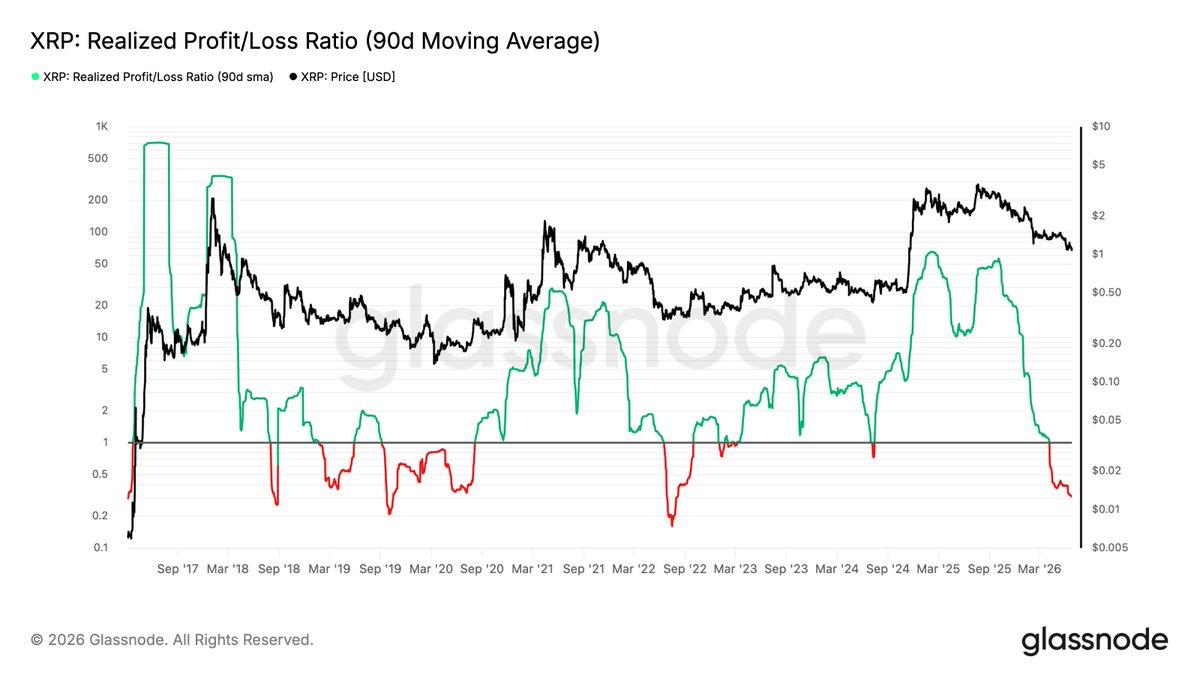
The smoothing is what makes it meaningful. This isn’t a one-day spike in panic selling, it’s a sustained structural shift, with a growing share of XRP holders exiting underwater over months, not days. The historical context sharpens the point: the last time this ratio was this depressed was the 2022 bear-market bottom zone. That cuts both ways, though. It’s not a buy signal on its own, because the ratio can stay depressed for long stretches, but it does suggest the capitulation phase is deepening rather than just beginning.
The Macro Backdrop
None of this is happening in isolation. Crypto markets are currently tethered to broader economic signals, particularly expectations around Federal Reserve interest-rate policy, which shape whether investors are in a risk-on or risk-off mood and Strait of Hormuz most recent escalation. In the current risk-off environment, speculative assets like XRP tend to be sold among the first and hardest, which is part of why the on-chain selling has been so persistent. Until that macro backdrop shifts, relief rallies in assets like XRP have tended to be sold into rather than sustained.
READ MORE:
 Why an AI Bubble Burst Could Fuel the Crypto Bull Market
What It Means for Holders
For anyone holding through this, the honest framing matters. Capitulation phases like this one are painful, and historically they have often coincided with the later stages of a market reset, the kind of washout that has preceded past recoveries. But “often coincided with” is not “marks the bottom.” The same on-chain data that shows deep capitulation also shows it can persist for extended periods, so this is a description of where the market is, not a forecast of when it turns.
The level everyone is watching is $1 – level which hasn’t been seen since October 10, 2026 flash crash. A clean breakdown below it, with no structural support visible until sub-$1 territory, could open the door to further downside and continued consolidation. Holding that line, especially with the elevated bounce volume seen today, could instead invite a relief attempt toward the $1.10 to $1.12 resistance. Which way it resolves is the question the next sessions will answer, and the data, for now, describes a deepening washout rather than a confirmed floor.
This article is for informational purposes only and does not constitute financial advice. Consult a professional before making investment decisions.The post XRP Nears $1 as On-Chain Losses Hit a 2022-Era Low appeared first on Coindoo.