The number of active addresses was at 47.63K, new addresses were at 4.75K, and all transactions were at 3.7 million on November 14. XRP remains below its nine-day EMA, while the descending ch
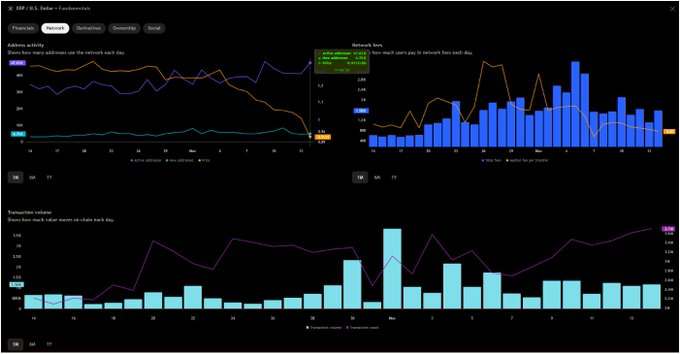
- The number of active addresses was at 47.63K, new addresses were at 4.75K, and all transactions were at 3.7 million on November 14.
- XRP remains below its nine-day EMA, while the descending channel reflects persistent selling pressure across recent trading sessions.
- An RSI reading of 25.69 signals oversold conditions, but network activity and a quarterly ETF filing cannot confirm a price reversal.
XRP network activity has risen even as the price is down, creating a bifurcation in the blockchain participation and trading sessions over the past few days.
Network Participation Climbs Despite Falling Prices
Xaif Crypto reported rising network participation as XRP continued losing ground during November. Active addresses reached 47.63K on November 14, approaching their highest monthly reading. Meanwhile, new addresses stood at 4.75K, indicating continued participation across the network.
Source:
X
The daily transactions on November 14 also rose to 3.7 million. This was the most transactions made in the previous month. But XRP fell to $0.9133 in the same period.
When analyzing market conditions, the difference between these readings should be noted. Active addresses indicate participation, number of transactions indicates network use. They're a combination of proof of activity outside of the market value of the token.
Another indicator of blockchain activity during this period is network fees. The charts provided reflect fee variations as well as participation over time. Increase in address counts, however, is not directly correlated to fee revenue. If these measurements increase over time, then this would be more proof of continued use.
XRP Price Structure Remains Under Selling Pressure
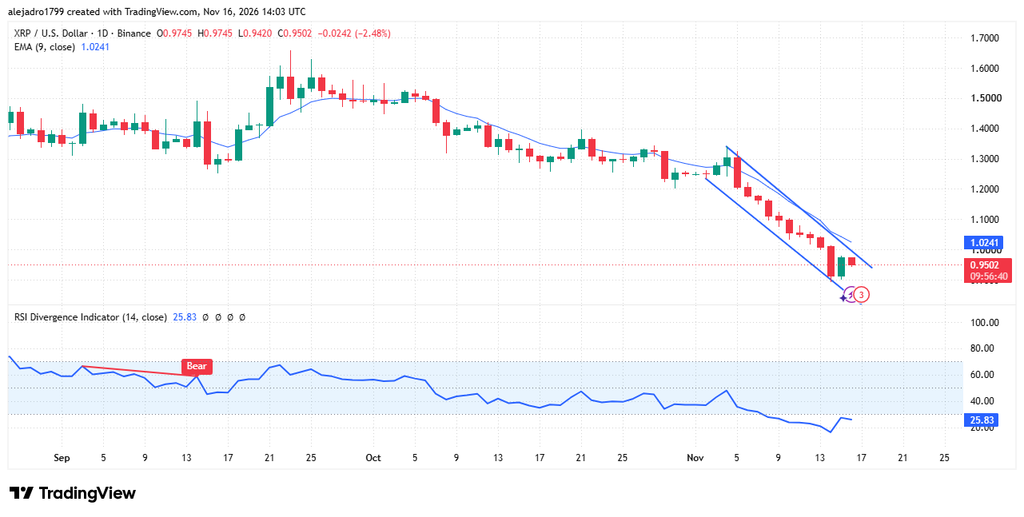
XRP's TradingView chart as of writing, does not look as favorable. The token was trading at $0.9477, dropping 2.74% from the previous day's price. This came after a couple of weeks of declining trading levels and lower highs.
Source:
Tradingview
The XRP trading price started the month of September trading around the price of $1.40, but then buyers pushed XRP towards the price of $1.60. This recovery was unsuccessful, and during the later sessions sellers took control. But October was to be the month to see even more weakness, with the token falling below $1.40.
Selling pressure drove the drop in November. The XRP price eventually fell below $1.00 and dipped significantly. The new chart has the token in a downtrend channel.

The upper boundary of the channel remains as a resistance that is falling. Meanwhile, its bottom line traces the latest sell-off. A continuation of the break above this structure would be a sign of improvement.
EMA and RSI Reveal Weak Market Momentum
The nine-day exponential moving average currently stands at $1.0236. XRP remains below this indicator, reflecting continued short-term selling pressure. Consequently, reclaiming that average would become an important technical development.
Another measure of the prevailing conditions is the Relative Strength Index. It is currently at 25.69, which is lower than the usual 30 value. This will put XRP in a technically oversold position after a long downtrend.
But, an oversold reading doesn't mean a price recovery is imminent. Sellers might have some control despite potential temporary rebounds. The $0.90 level number is still significant as a downside reference in the analysis provided.
Another institutional snapshot is a filing of a Canary XRP ETF Form 10-Q. Its trading symbol is XRP and its exchange is Nasdaq. It is a quarterly reporting period that ends on September 30, 2026.
The filing is a reporting document and not a sign of new regulatory approval. It also does not give any indication of extra investment flows. However, the disparity between network usage and cost has yet to be resolved.
At this point, there are two opposing signals for XRP in the market and blockchain data. Transaction volume has risen monthly and technical indicators remain quite weak. It's not clear if any increased network participation will follow a price recovery. More activity readings and a prolonged technical recovery will give more confirmation.