XRP news today centers on veteran trader Peter Brandt, who shared a long-term chart of XRP that points to a future price near $5.40. This XRP price prediction comes with a clear note: a chart
XRP news today centers on veteran trader Peter Brandt, who shared a long-term chart of XRP that points to a future price near $5.40.
This XRP price prediction comes with a clear note: a chart is not a trade.
Brandt posted the monthly XRP/USD chart on September 21. He said the structure on it implies a move toward $5.40 over the long run. No date came with that number.
XRP was trading close to $1.53 when the chart drew attention, up about 2.47% on the day, based on the figures shown in Brandt's post.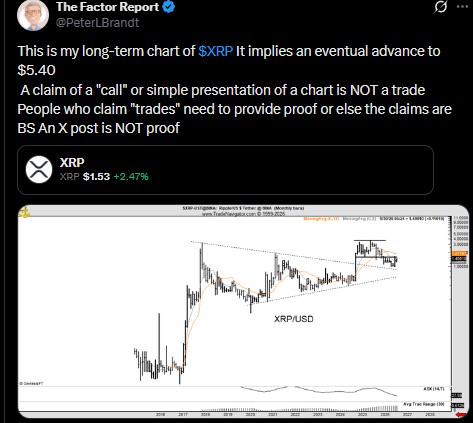
What Does Peter Brandt's XRP Chart Show?
Brandt's chart covers roughly a decade of XRP price history. It uses monthly candles, so each bar covers one full month of trading.
The chart includes two sloped lines. One rises from old cycle lows. The other falls from past major highs. Together they form a large, drawn-out shape across the years.
At the time shown, XRP sat around $1.49. The 18-month moving average was near $1.88. That means XRP was trading below its own longer-term average.
XRP Price History Behind This XRP Price Forecast
The chart tells a story in stages. Here is the rough path XRP took, based on the candles shown:
Period
What Happened
2015-2016
XRP built a base at low prices
2017
Sharp rally into a major 2018 peak
2018-2020
Long decline into a major low
2021
Rally to a lower high than 2018
2022-2024
Long sideways squeeze
2024-2025
Breakout rally to the $3-$3.50 zone
2025-2026
Pullback and sideways move
Connecting the 2018 and 2021 highs makes a downward-sloping line. Connecting the 2020 low and later lows makes an upward-sloping line. The space between them narrowed for years before XRP broke higher in 2024 and 2025.
XRP Price Forecast: How Far Could XRP Reach $5.40?
Using $1.54 as a starting point, XRP would need to rise about 251% to reach $5.40. That works out to roughly 3.5 times the current price.
Using the $1.49 level marked on the chart itself, the move to $5.40 would be closer to 262%, or about 3.6 times.
Brandt used the word "eventual" in his post. He did not attach a timeframe, so the $5.40 level is a longer-term technical objective, not a near-term price target.
Is XRP Price Above Or Below Its Key Average?
XRP remains below its 18-month moving average. The average sits near $1.88, while XRP trades close to $1.49. That is a gap of roughly 20.6%.
A faster, shorter-term moving average sits closer to the current price. XRP has been trading nearer that faster line while the slower 18-month average stays overhead.
What Do The Chart's Indicators Say?
Two indicators sit below the main price chart.
ADX (14) reads 27.59. This measures trend strength, not direction. A reading above 25 generally signals a trend with some force behind it, though the indicator alone does not say whether that trend is up or down.
30-month Average True Range is about 0.6126. This measures how wide XRP's monthly price swings tend to be. It does not point to a direction either.
What Do The Latest Candles Show?
The most recent five monthly candles sit inside a small, narrowing wedge on the right side of the chart. Several candles have long lower wicks, which can suggest buying showed up at lower prices during the month.
At the same time, upper wicks show that price struggled to hold gains near the top of that range. The newest candle pushed back up toward about $1.49, but it stayed under the 18-month average.
XRP Price Today: Quick Recap
XRP trades near $1.49 to $1.53, depending on the exact time checked
The 18-month moving average sits near $1.88
This XRP price forecast implies a longer-term move toward $5.40
No date is attached to that $5.40 level
ADX near 27.59 shows some trend strength, without confirming direction
XRP remains inside a smaller pullback structure following its 2025 highs
Brandt's Own Disclaimer
Brandt added a note to his post that is worth repeating. He said posting a chart or a price call is not the same as making a trade. He added that anyone claiming an actual trade should be able to show proof, and that a social media post alone is not proof of a trade.
That distinction matters for how readers should treat the $5.40 figure. It is Brandt's read of the chart's long-term structure, not a confirmed trade or a guaranteed outcome.
Financial Disclaimer
This article is for informational purposes only and does not constitute financial, investment, or trading advice. Cryptocurrency prices are highly volatile, and past chart patterns do not guarantee future results. Always do your own research and consult a licensed financial advisor before making investment decisions.