Key Takeaways XRP is currently trading near $1.10. Santiment reports record lows in 30-day and 365-day MVRV ratios. The price has pushed back above the 50-period and 100-period SMAs on the 4h
Key Takeaways
- XRP is currently trading near $1.10.
- Santiment reports record lows in 30-day and 365-day MVRV ratios.
- The price has pushed back above the 50-period and 100-period SMAs on the 4h chart.
- Still under all SMAs on the daily chart.
XRP is showing signs of potential stabilization as on-chain exhaustion meets an early technical recovery, though market participants are watching for volume confirmation at overhead resistance levels.
Current Market Context
On-chain data from Santiment indicates that both short-term and long-term holder cohorts currently hold significant unrealized losses, with 30-day and 365-day MVRV ratios at approximately -45% and -47%. The MVRV (Market Value to Realized Value) ratio serves as a critical thermometer for market sentiment; it essentially compares the current market price to the “average cost basis” of all tokens in circulation. When these figures plummet into negative double digits, it historically signals that speculative “froth” may have been removed, potentially leaving only long-term conviction holders in the market.
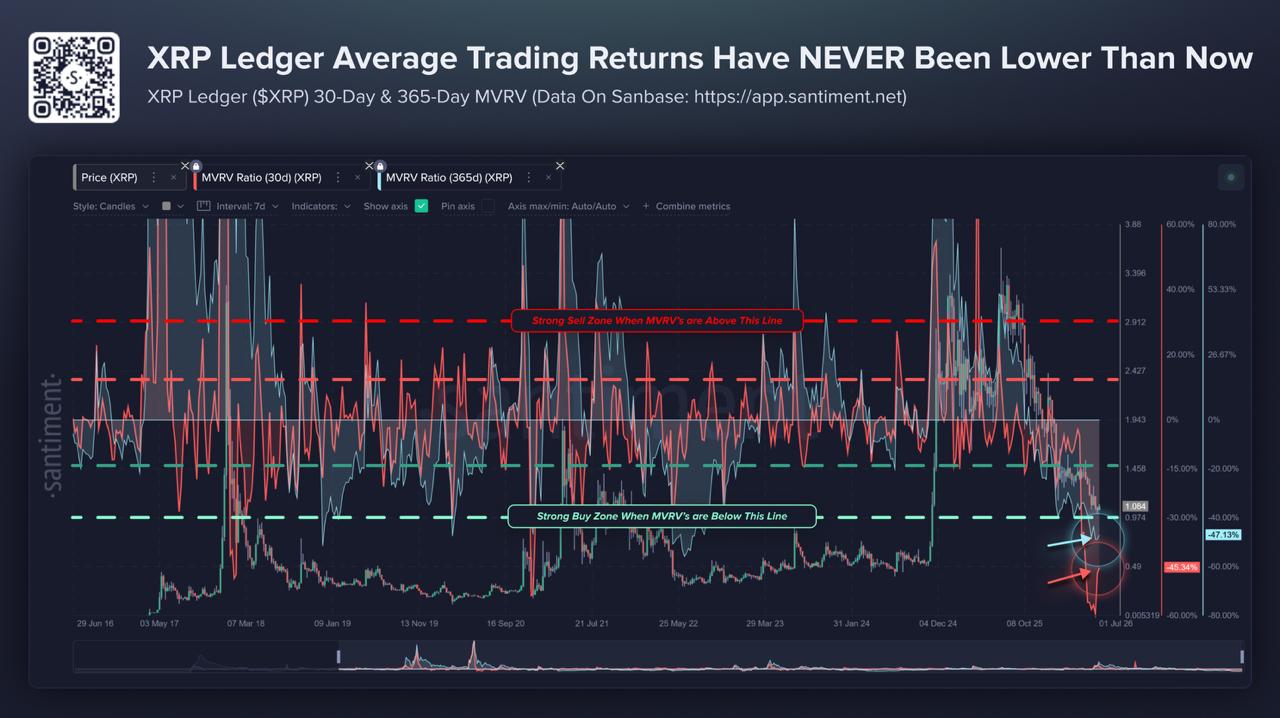
XRP Ledger MVRV buy zone.
These levels represent extreme realized-value stress when measured against XRP’s 12-year history. Such positioning often precedes a contrarian reaction, as the majority of forced selling may have been absorbed by the market. Price action on the 4-hour chart reflects this potential shift. XRP recently reclaimed the 50-period SMA at $1.0563 and is currently testing the 100-period SMA at $1.0991. This development signals a technical recovery from the $1.035 base formed in late June.
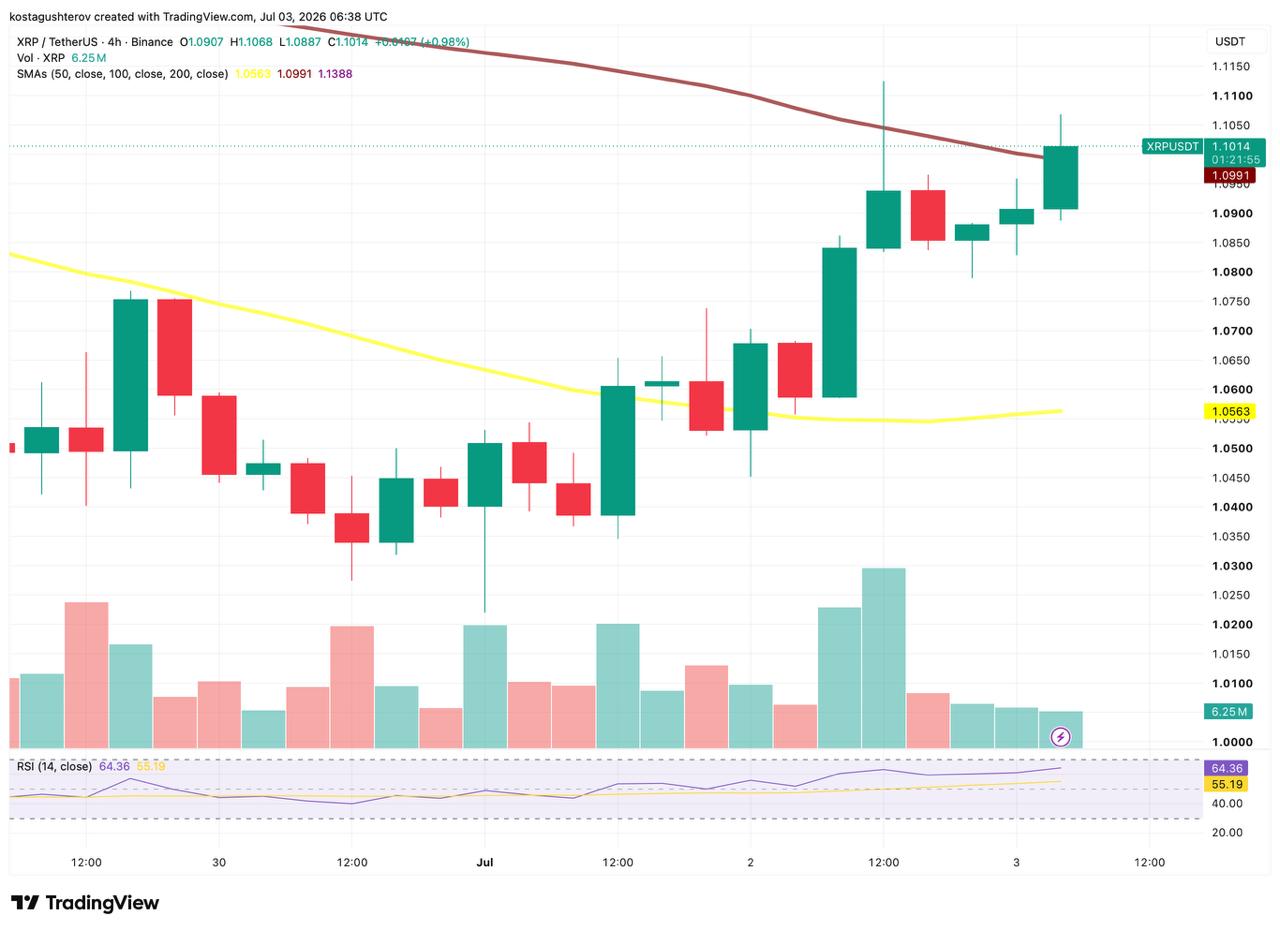
XRP 4-hour technical chart.
Convergence and Constraints
The on-chain extremes and the recent technical reclaim point in a similar direction. The Relative Strength Index (RSI) is currently at 64.36, rising above the 55.19 signal line, which correlates with the recent momentum shift. However, as the RSI nears the overbought threshold, the current move may be reaching a point of maturity.
Caution remains appropriate for those assessing the strength of this bounce. In professional technical analysis, volume is the “fuel” that validates price movement. The current advance into the 100-period SMA is occurring on lighter volume than the surge seen on July 2. When price rises without a corresponding increase in volume, it may suggest that the move lacks the institutional conviction required for a sustained breakout, often signaling that the rally could be vulnerable to profit-taking.
READ MORE:
 Kalshi’s Crypto Pivot: 25x Growth and the Challenge to Wall Street
Key Levels to Monitor
- Immediate Pivot ($1.0991): The 100-period SMA serves as the immediate threshold. Price holding above this level could keep the relief-rally scenario intact.
- Overhead Resistance ($1.1388): The 200-period SMA represents the next primary hurdle. Clearing this level may be required to transition from a relief bounce to a broader trend change.
- Support Floor ($1.0563): A slip back under the 50-period SMA could undercut the current setup, regardless of how stretched the MVRV metrics appear.
The convergence of oversold on-chain positioning and an early technical reclaim on the 4-hour chart provides a constructive signal for a potential relief rally. However, it is essential to view this through the lens of the higher timeframe. While the 4-hour chart shows momentum shifting, the 1-day timeframe presents a starkly different reality: price remains firmly below the 50-day SMA ($1.2075), 100-day SMA ($1.2978), and 200-day SMA ($1.4861). These daily moving averages remain stacked in a bearish order, sloping downward and reinforcing a macro downtrend that has been intact since February.
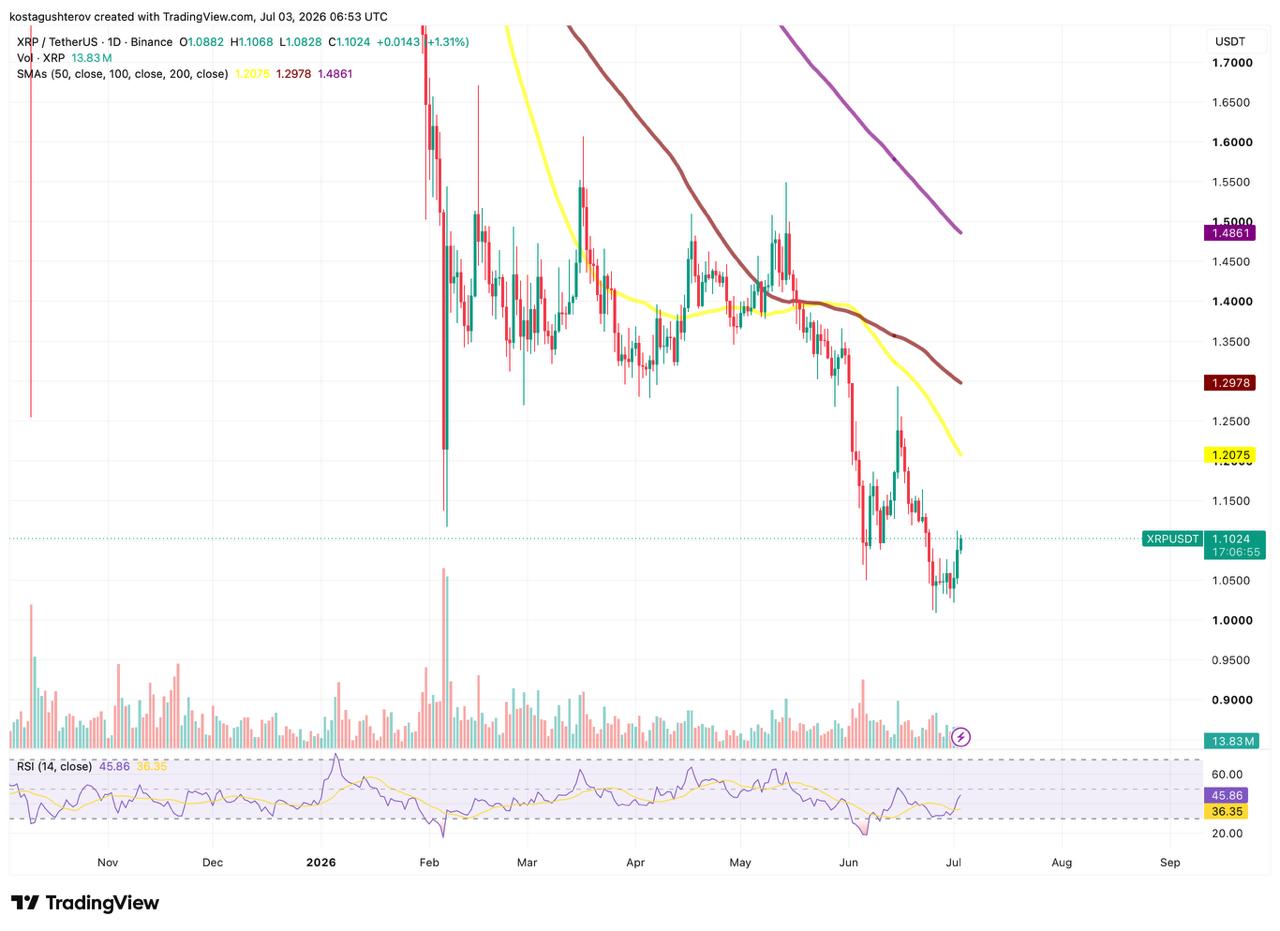
XRP 1-day technical chart.
Previous attempts to flip this trend have stalled against these same descending averages. The current price action at $1.10 sits within a falling channel, structurally mirroring earlier failed relief efforts. Furthermore, while the daily RSI is recovering, it remains near 45.88 and has yet to reclaim the 50 midline. Given this, the current move may still be characterized as a counter-trend bounce within a larger bearish structure rather than a confirmed reversal.
Confirmation of sustained buying interest, specifically a reclaim of the 50-day SMA at $1.2075, could be necessary before a more significant trend change is established. Until then, the burden of proof remains on the bulls, as the base case continues to favor a relief rally that may be vulnerable to the same overhead resistance that absorbed prior attempts earlier this year.
This article is for informational purposes only and does not constitute financial advice. Cryptocurrency investments involve high risk. Consult a professional before making any investment decisions.The post XRP Price Analysis: Evaluating the Strength of the July Bounce appeared first on Coindoo.