XRP price analysis suggests the cryptocurrency is beginning to show stronger underlying momentum as network activity improves and whale participation increases. The latest market structure in
XRP price analysis suggests the cryptocurrency is beginning to show stronger underlying momentum as network activity improves and whale participation increases. The latest market structure indicates buyers are attempting to establish a stronger base above the important $1.00 support level, although the broader recovery has yet to receive full technical confirmation.
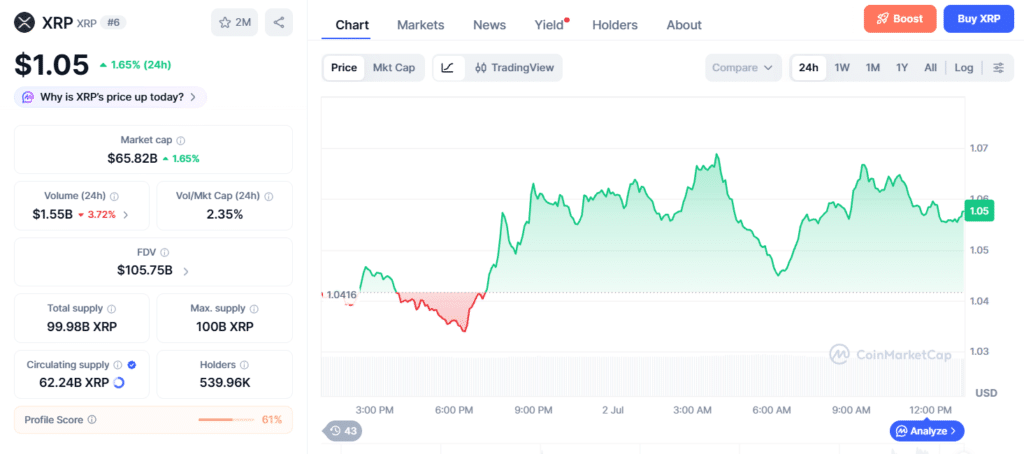
Institutional interest has also remained steady, adding another layer of support to the market’s outlook. XRP is currently trading around $1.05, up 1.52% over the past 24 hours, with a market capitalization of $65.74 billion and a 24-hour trading volume of $1.54 billion.
What Does XRP Price Analysis Suggest About the Current Market Structure?
XRP price analysis points to an accumulation phase developing around the $1.00 support area even though the broader trend remains under pressure. The XRP Ledger recorded 4,941 new wallet creations in a single day, marking its strongest daily growth in more than three months.
XRP Price Analysis: Whale Accumulation Puts $1.10 Breakout in Focus 3
Meanwhile, CryptoQuant reported the All CEX Whale vs Retail Spread at 50.9%, while Binance’s reading stood at 44.6%, indicating that larger holders have become more active even as retail participation remains cautious. The divergence suggests that whales are gradually increasing exposure while smaller investors continue waiting for stronger confirmation from price action.
Why Is Network Activity Becoming an Important Indicator?
Improving blockchain activity and institutional participation are providing additional support for XRP’s current market structure. Spot XRP ETFs attracted $15.34 million in net inflows on June 29, with Bitwise contributing $11.94 million of that total.
Throughout June, XRP ETFs accumulated more than $62 million in inflows, lifting cumulative net flows to approximately $1.48 billion. These developments indicate continued investor interest despite XRP remaining below several major technical resistance levels.
XRP price analysis shows the token advanced 1.41% during the latest 24-hour session to close at $1.0613. Despite the gain, XRP still underperformed the broader cryptocurrency market by 1.27%, suggesting the recovery remains measured rather than aggressive.
The strongest buying activity emerged when XRP broke above $1.0560 supported by approximately $5.34 million in trading volume, representing a 1,433% increase over the preceding hourly average. Buying momentum continued through the breakout window, generating nearly $11.31 million in trading volume and lifting XRP to a session high near $1.0665.
What Are Technical Indicators Signaling?
XRP price analysis continues to show gradual improvement, although technical confirmation remains incomplete. The latest recovery attempt has established higher lows at $1.0318 and $1.0410, reinforcing the importance of the $1.00 support zone. The breakout above $1.0560 improved the short-term structure, but buyers still need to maintain strength above $1.0665 to avoid another range-bound bounce.
Trading activity during the breakout strengthened considerably, although total 24-hour volume remained only 5.95% above the seven-day average, indicating the broader move has not yet developed into a full trend reversal. TradingView indicators present a mixed picture.
The Relative Strength Index (14) has improved from roughly 33 during the recent oversold phase to 36.50024, but it remains in neutral territory. The Average Directional Index (14) stands at 26.62438, also indicating a neutral trend. Momentum (10) continues to generate a sell signal, while the MACD Level (12,26) has shifted to a buy indication.
The 50-day Simple Moving Average at $1.21335 and the 100-day Simple Moving Average at $1.29995 continue to reflect broader weakness. Separately, XRP remains below its key exponential moving averages, including the 20-day EMA near $1.11, 50-day EMA near $1.20, 100-day EMA near $1.31, and 200-day EMA near $1.52. Meanwhile, the negative Chaikin Money Flow suggests buyers have yet to fully regain control of the market despite improving momentum.
What Does Derivatives Activity Reveal About Trader Sentiment?
Derivatives markets suggest leverage is still adjusting while positioning remains relatively balanced. XRP price analysis shows futures trading volume reached approximately $1.64 billion, while spot trading volume totaled $358.53 million.
Open interest increased 1.31% to around $2.30 billion, reflecting continued trader participation. Options activity also strengthened, with options volume climbing 68.92% to $3.88 million, while options open interest increased 5.68% to $24.72 million, indicating growing interest in derivatives activity.
During the past 24 hours, XRP futures liquidations totaled approximately $2.21 million, including around $887,261 in long positions and $1.33 million in short positions. Around 838 traders were liquidated worldwide as XRP’s daily price volatility exceeded 3.83%. The balanced liquidation profile indicates that neither bullish nor bearish traders currently hold a decisive advantage.
Which Price Levels Could Determine the Next Move?
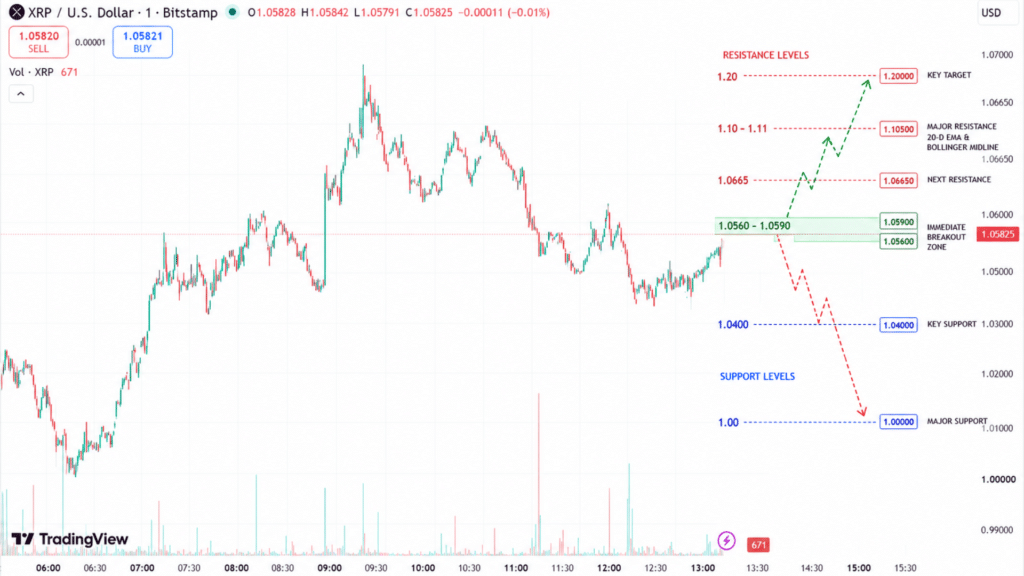
The immediate support and resistance zones remain the most important areas for traders to monitor. XRP price analysis identifies $1.0560-$1.0590 as the immediate breakout zone that bulls now need to defend. The next resistance stands near $1.0665, while the most significant technical hurdle remains between $1.10 and $1.11, where the 20-day EMA and the Bollinger Bands midline converge.
XRP Price Analysis: Whale Accumulation Puts $1.10 Breakout in Focus 4
A successful reclaim of $1.10 could shift attention toward $1.20. On the other hand, failure to hold above $1.04 would place the $1.00 support zone back in focus, reinforcing that the current move remains a support-building phase rather than a confirmed recovery.
Conclusion
XRP price analysis indicates that improving wallet growth, stronger whale participation, and continued ETF inflows are providing constructive signals beneath the surface. However, XRP continues to trade below several key moving averages, while technical indicators suggest buyers are only gradually regaining momentum.
Until the price establishes a sustained move above the $1.10-$1.11 resistance zone, the market is likely to remain in a support-building phase rather than a confirmed bullish reversal. The coming sessions will determine whether improving network activity and institutional participation can generate the buying strength needed to validate a broader recovery.
Glossary
Wallet Creation: New XRP wallets opened on the network.
RSI: Measures price momentum and market strength.
Chaikin Money Flow (CMF): Tracks buying and selling pressure.
XRP Ledger: Blockchain that powers XRP transactions.
Spot ETF Inflows: Fresh investment entering spot XRP ETFs.
Frequently Asked Questions About XRP Price Analysis
What does XRP price analysis show right now?
XRP price analysis shows buyers are building support near the $1.00 level.
What is the key price level for XRP now?
The main level to watch is $1.10 because it is the next important resistance.
Is XRP showing signs of recovery?
Yes. XRP is showing early recovery signs, but the trend is not fully confirmed.
Why is the $1.00 support important for XRP?
Holding above $1.00 helps buyers keep the current recovery attempt alive.
Why is XRP network activity increasing?
More new wallets are being created, showing growing activity on the XRP Ledger.
Sources
Coindesk
Coinmarketcap
Tradingview
Coinglass
Read More:XRP Price Analysis: Whale Accumulation Puts $1.10 Breakout in Focus ">XRP Price Analysis: Whale Accumulation Puts $1.10 Breakout in Focus