XRP Price Breaks Its Downtrend: Is $2 Finally In Sight?
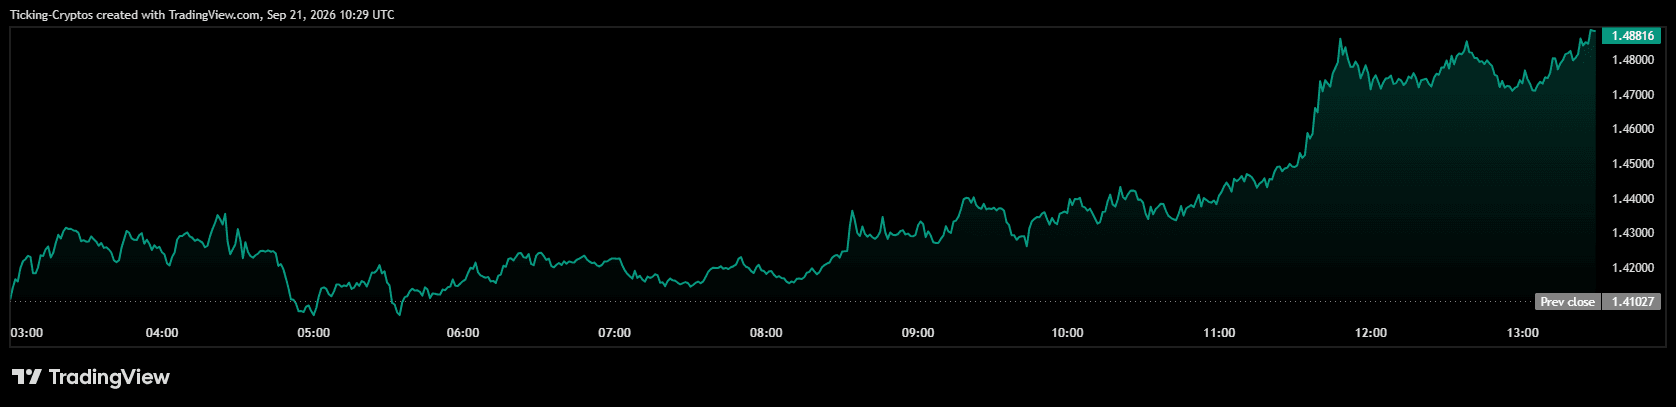
Where Is The XRP Price Right Now? $XRP is trading at $1.4895, up 5.62% on the session from a previous close of $1.4103. The move came in one clean burst at roughly 11:30 UTC, the same minute
A
AnonymousCryptoCompass newsroom
September 21, 2026
3 min read
NEWS
CryptoCompass editorial visual for markets coverage.
Where Is The XRP Price Right Now?
$XRP is trading at $1.4895, up 5.62% on the session from a previous close of $1.4103. The move came in one clean burst at roughly 11:30 UTC, the same minute $Bitcoin ripped through $84,000, so this is the majors moving together rather than anything Ripple-specific. XRP is leading them, though: CoinDesk data had XRP up 7.43% on the day against 4.42% for Bitcoin. Zoom out and XRP has gained roughly 27% over the past 30 days, though it is still down around 58% over a year.
XRP Chart in USD
What Does The XRP Chart Actually Show?
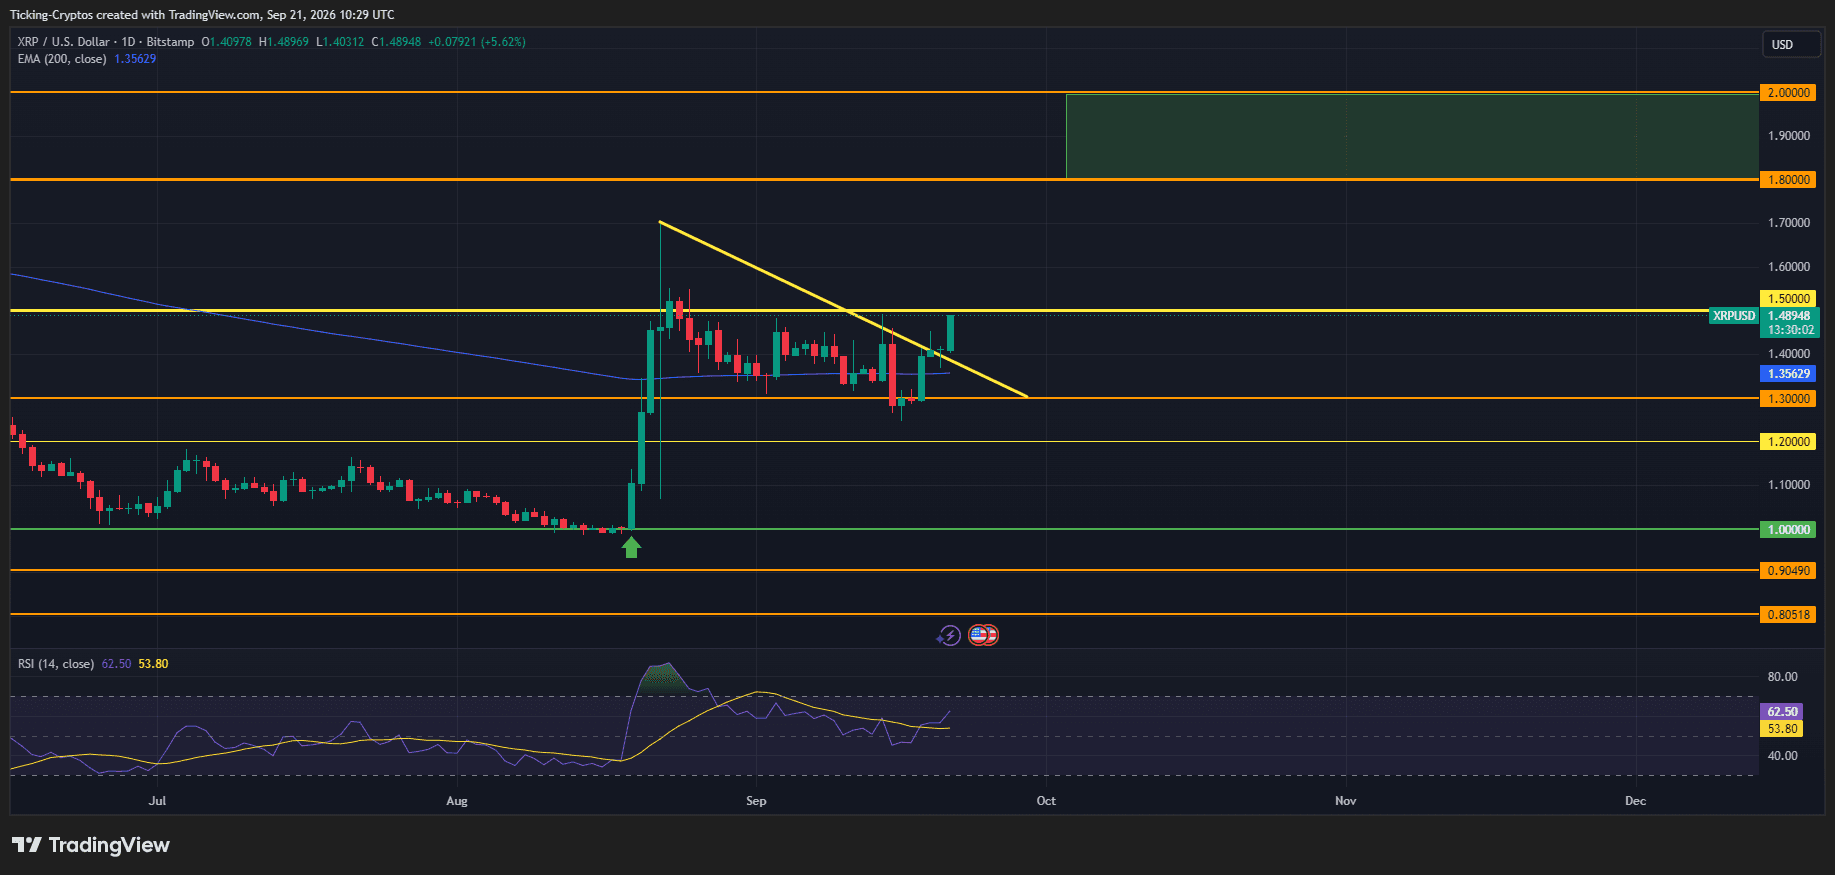
The important line just broke. Since the late-August spike to $1.70, every rally was capped by a descending trendline, and today's candle closed above it with conviction. Underneath that, the structure has been quietly improving for weeks: the $1.00 floor from mid-August held, the $1.30 support held on the September dip, and price reclaimed the 200-day EMA at $1.3563 and has stayed above it. Daily RSI sits at 62.50 with its signal line at 53.80, so momentum is rising and there is still headroom before overbought territory near 80.
Why Did XRP Move So Fast?
Positioning. Market data showed a wave of new short bets building on XRP from September 18 onward, with those shorts not yet forced to close because funding rates were still positive. A vertical move into that setup does the forcing for you. Add a market-wide risk bid after last week's Fed meeting and you get a 5% candle with no XRP headline attached to it.
XRP Price Prediction: Is $2 Realistic For XRP?
Not yet, and the chart is blunt about why. There are two doors to get through first. $1.50 is immediate, and price is sitting right underneath it. Above that, the next real shelf is $1.80, and only a sustained move through $1.80 opens the $1.80 to $2.00 zone. From here that is roughly 34% of upside, so $2 is a target for a continued trend, not for this week. Analysts treat a sustained break above $2.00 as the single most important level in any XRP forecast, which is exactly why it will be defended.
What Could Stop The XRP Rally?
Supply, mainly. Ripple unlocks 1 billion XRP from escrow on the first of every month and typically re-escrows 600 to 800 million, leaving 200 to 400 million to enter circulation. That is structural selling that arrives regardless of sentiment, and ETF demand has so far been modest against it: the seven US spot XRP ETFs hold about 977.92 million XRP, worth roughly $1.064 billion. On the chart, a failure at $1.50 that drops price back under the broken trendline would be the classic fakeout, and $1.30 becomes the level to defend.
Key Takeaways The investment bank projects the S&P 500 will hit 8,000 by late 2026 and climb to 9,000 by the close of 2027. The ambitious 2027 projection relies on earnings per share reaching
A reported $16.77 million loss involving UST, flagged by blockchain security monitor PeckShield, has renewed scrutiny of the trust assumptions embedded in stablecoin-based DeFi activity, wher
Key Takeaways Meta Platforms shares climbed approximately 3% during Monday’s premarket session, reaching near $683. Sunday evening saw temporary service disruptions across Facebook and Instag

 XRP Chart in USD