What the Latest XRP Price Data Is Revealing to Traders The XRP price has found itself in some of its most extreme territory in recent memory, and the on-chain data being collected right now i
What the Latest XRP Price Data Is Revealing to Traders
The XRP price has found itself in some of its most extreme territory in recent memory, and the on-chain data being collected right now is difficult to ignore. A wave of forced liquidations, collapsing Open Interest, and a Sharpe Z-Score that has plunged deep into negative ground are all converging at once.
Whether this is the kind of exhaustion that precedes a real recovery, or simply the market’s way of dragging things out a little longer before the next leg down, is the question everyone is sitting with.
What makes this particular moment worth paying close attention to is not just the XRP price sitting at $1.03, but the pattern of signals surrounding it that have historically shown up right before significant upside moves.
XRP Price Drops Below $1.03 as $3 Million in Longs Get Wiped Out
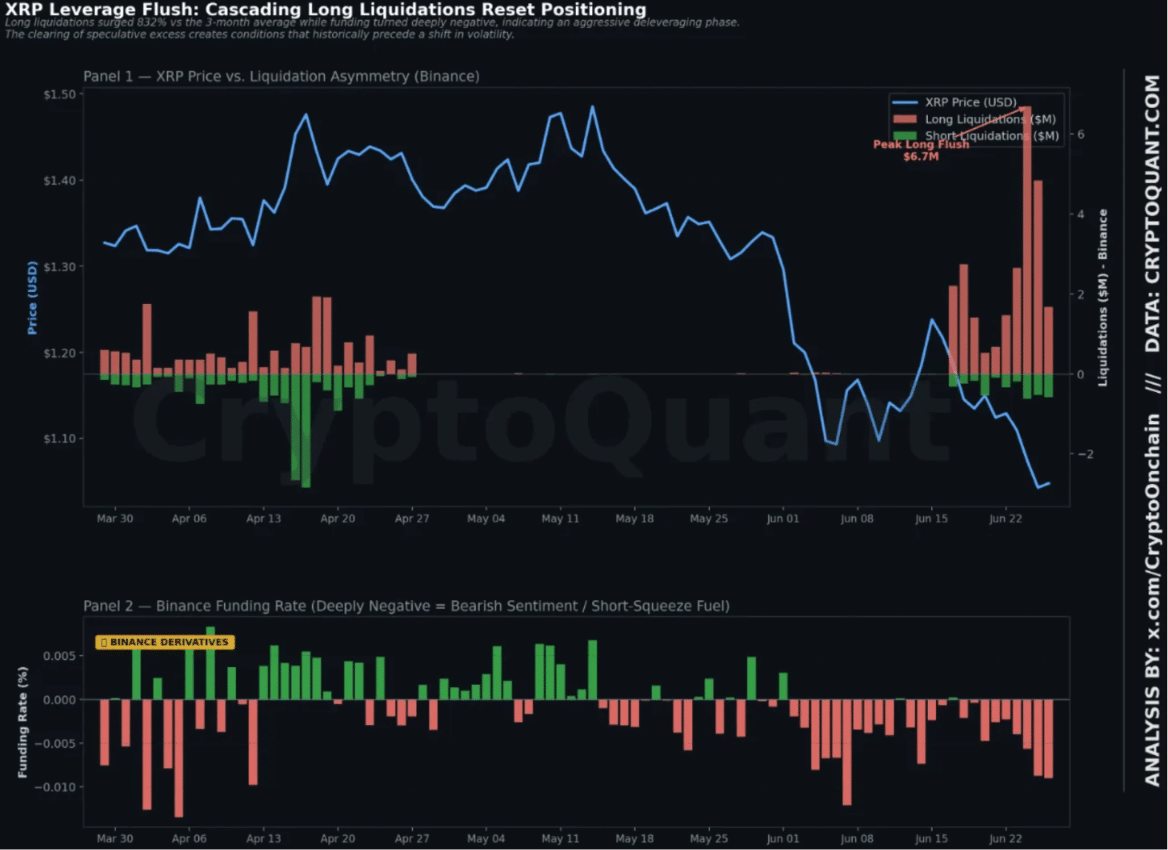
When leverage gets too heavy on one side, the market tends to clear the table violently. That is exactly what happened here. Nearly $3 million in long positions were liquidated at the peak of this decline, ejecting bullish traders from their positions in a short window. It is the kind of move that looks brutal in the moment but often acts as a pressure valve.
Alongside those liquidations, funding rates flipped sharply negative, which means traders paying to hold short positions are now in the driver seat. Open Interest dropped from approximately $1.18 billion down to roughly $1.04 billion, shedding over $140 million in speculative exposure within a compressed timeframe. In traditional equity markets, this would resemble a futures rollover or a major short-spike event clearing out the crowded trades.
The encouraging layer within all of this is that Binance reserve data remained relatively stable throughout the decline. Spot holders, the longer-term participants who actually own the asset rather than trading derivatives on top of it, are not aggressively selling. That behavioral divergence between derivatives traders and spot holders is a nuanced but meaningful signal when assessing where demand actually lives.
Historic Oversold Readings Mirror Pre-Breakout Conditions From 2024 and 2025
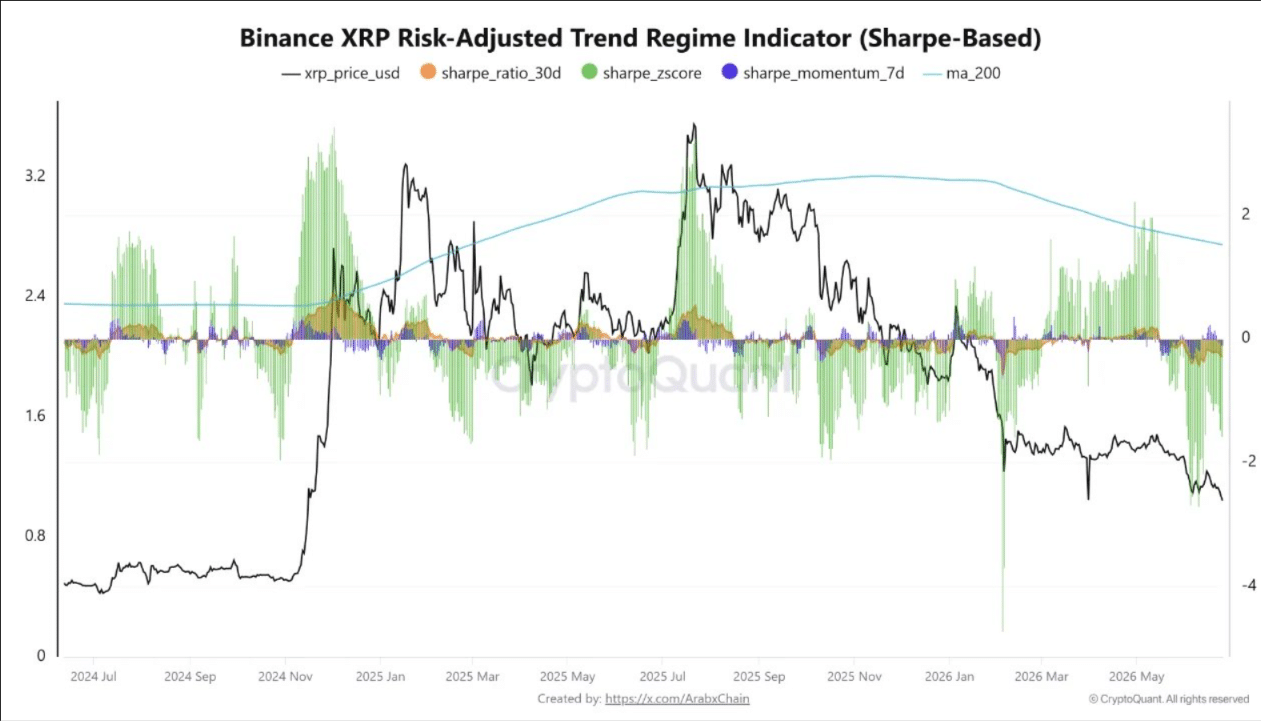
The Sharpe Z-Score is not a term that gets discussed enough in mainstream crypto coverage, but it deserves more attention than it typically receives. It measures how far an asset has deviated from its expected return relative to its own volatility. When it drops deep into negative territory, it signals that the XRP price has fallen well beyond what normal market distribution would suggest.
The current reading is sitting at levels that match two prior instances: the period just before the November 2024 breakout and the weeks leading into the July 2025 rally. Both of those moments felt like dead ends at the time, and both preceded substantial recoveries. That historical alignment does not make a recovery guaranteed, but it does make the risk-reward calculation more interesting for those watching closely.
Even with this setup, the XRP price remains pinned below its 200-day Moving Average, which is the clearest line in the sand separating bearish from bullish control of the trend. Until that reclaim happens, any recovery talk is speculative by nature.
What Would Actually Confirm an XRP Price Recovery From Here
Recovery in situations like this rarely comes from a single catalyst. What traders should be watching is a simultaneous rebuilding of Open Interest alongside funding rates moving back toward neutral or positive. If those two metrics begin trending in that direction while spot demand picks up, the current deleveraging cycle could quietly transform into the foundation for the next move higher.
Without that alignment, the XRP price risks grinding sideways or drifting lower as the market looks for a more convincing demand base to build from.
Conclusion
The XRP price may be sitting in historically oversold conditions, but oversold does not mean the bottom is in. What the data does confirm is that speculative leverage is being cleared, spot holders are holding firm, and the pattern rhymes with prior recovery setups. The next few weeks will reveal whether this is accumulation in disguise or a market still searching for its floor.
Frequently Asked Questions
What caused the recent XRP price drop? A wave of forced liquidations on leveraged long positions, totaling nearly $3 million, combined with negative funding rates and declining Open Interest pushed the XRP price sharply lower.
What does oversold mean in crypto? Oversold means an asset has fallen significantly beyond what its historical volatility and expected returns would normally justify, often measured through indicators like the Sharpe Z-Score or RSI.
What is Open Interest and why does it matter for XRP? Open Interest represents the total value of active derivatives contracts. When it drops sharply, as it did from $1.18 billion to $1.04 billion here, it signals that speculative positions are being closed or liquidated.
Is the XRP price likely to recover soon? The current on-chain signals mirror conditions seen before the November 2024 and July 2025 rallies, but confirmation requires renewed spot demand and a reclaim of the 200-day Moving Average.
What is the 200-day Moving Average? It is a widely followed technical indicator that tracks the average closing price over the past 200 days. Assets trading below it are generally considered to be in a bearish trend.
Glossary of Key Terms
XRP Price: The current market value of XRP, the native digital asset of the XRP Ledger developed by Ripple Labs.
Liquidation: The forced closure of a leveraged trading position when a trader cannot meet margin requirements, resulting in automatic selling.
Open Interest (OI): The total dollar value of outstanding derivative contracts that have not been settled, reflecting overall market participation.
Funding Rate: A periodic payment exchanged between long and short position holders in perpetual futures markets, indicating sentiment direction.
Sharpe Z-Score: A statistical measure showing how far an asset has deviated from its expected return relative to its volatility, used to identify extreme market conditions.
200-day Moving Average (200 MA): A long-term trend indicator that averages the closing price over 200 trading days, widely used to distinguish bull and bear trends.
Deleveraging: The process of reducing borrowed positions in the market, often triggered by price moves that force margin calls or voluntary risk reduction.
Disclaimer: This article is intended for informational purposes only and does not constitute financial or investment advice.
Sources
ambcrypto
cryptoquant