
DeFi2 min read
Injective staking reaches an all-time high
@injective has announced that staking on its network has hit a new all-time high, with 58.8 million $INJ tokens now locked with validators. That figure represents roughly 59% of the protocol'
The XRP price has dropped to a level that one analyst considers the most important point on the chart. The coin now trades near $1.10 after a correction from its December peak above $3.00. Th
The XRP price has dropped to a level that one analyst considers the most important point on the chart. The coin now trades near $1.10 after a correction from its December peak above $3.00. This zone is the 50% midpoint of the recent range, a level that previously marked a major cycle bottom in 2021–2023.
The current XRP price action has brought attention from technical traders watching the weekly chart structure. A repeat of the historical pattern could set up XRP for another rally. However, a failure at this level might open the door to deeper losses.
The analyst from @CoinvoTrading posted a weekly XRPUSD chart comparing two market cycles. The 2021–2023 structure shows XRP falling to the 50% midpoint of its high-to-low range before forming a bottom. That bottom preceded a multi-month recovery and eventual breakout.
The same logic now applies to the 2024–2026 range. The XRP price rallied to a new high near $3.40 before correcting lower. The price currently sits just below the 50% midpoint of that range, which sits around the $1.20 area. The analyst argues this zone offers a high-probability structural support level.
— Coinvo Trading (@CoinvoTrading) July 25, 2026
$XRP HOLDERS: WE'VE REACHED THE MOST IMPORTANT LEVEL…From 2021-2023: the bottom happened at 50% of the range. 2024-2026: XRP just reached 50% of the range. XRP doesn't need to become the next bank transaction layer to perform.It just needs attention. This is it. pic.twitter.com/ePwwA2oKbJ
The thesis suggests XRP does not need new fundamental catalysts to move higher. Historical attention and positioning around these key technical levels have produced major price swings in the past.
The 50% level acts as a measured midpoint between the high and low of a given range. It differs from Fibonacci retracement levels but can sometimes align with them. Traders watch these zones because they often show areas where supply and demand balance shifts.
On the weekly timeframe, the 2021–2023 bottom formed at the 50% level of its range. Price then staged a recovery that lasted several months. The current structure shows XRP price approaching the same relative depth from its 2024 high.
The chart displays higher lows in the broader structure after the 2022–2023 bottom. This constructive formation supports the bullish case if the 50% level holds as support. A successful defense of this zone could open a path back toward the prior high near $3.40.
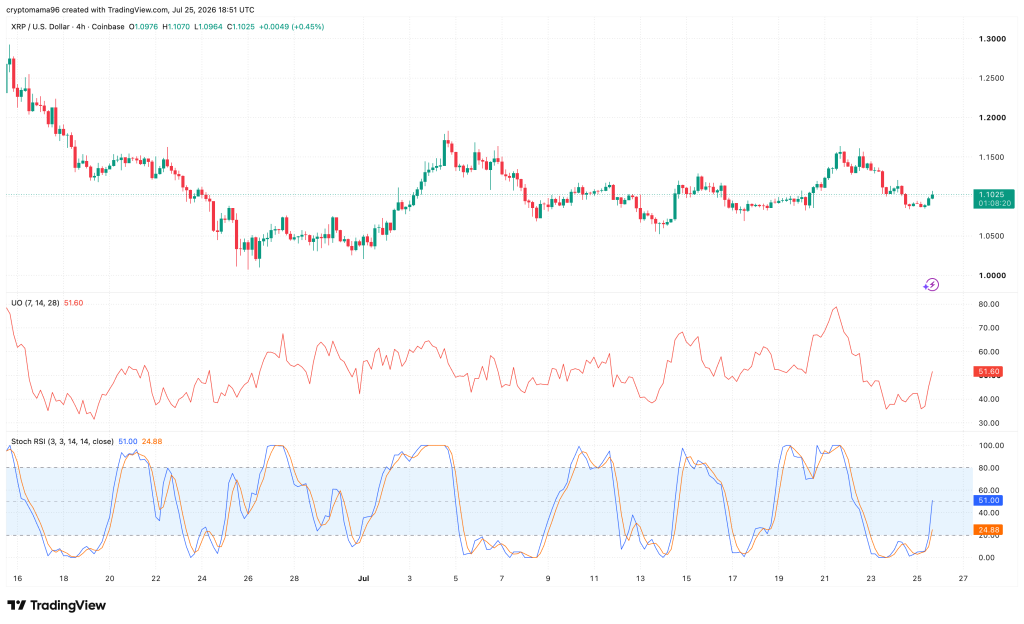
On the 4-hour timeframe, XRP trades around $1.10 after a prolonged correction. The sharp decline from $1.27 has moved into sideways consolidation over recent weeks. Buyers have defended the $1.09–1.10 zone, producing a series of higher lows.
The Ultimate Oscillator sits at 51.6, climbing back above 50. This reading shows momentum is improving. The Stochastic RSI also shows a strong move higher from oversold conditions. Neither indicator is overbought, leaving room for further upside.
 Source: TradingView
 Resistance levels stand at $1.12–1.13, then $1.15–1.16 from recent swing highs. A breakout above $1.16 would invalidate the series of lower highs. The major breakout zone rests at $1.18–1.20, where confirmation of a bullish continuation would emerge.
Immediate support holds at $1.09–1.10, with stronger demand near $1.06–1.07. A break below $1.02 would change momentum back to the bears and expose the $1.00 level.
Read also: Another Bitcoin Price Crash Incoming? Why the CLARITY Act Might Not Pass
The weekly chart thesis is a clear bullish scenario. If the 50% level acts as support like it did in the previous cycle, the XRP price could stage a major higher-timeframe bounce. The post argues that attention around these key technical levels has historically been sufficient for price movement.
Upside targets include the prior swing highs, then the $3.40 cycle high. The weekly timeframe suggests a multi-month or multi-year recovery path if the structure holds.
The bearish case needs sustained weekly closes below the marked 50% zone. A breakdown would weaken the historical analogy and open room for a deeper retracement. Broader market conditions, Bitcoin correlation, and liquidity risk could all play a role in invalidating the pattern.
The 4-hour chart leans moderately bullish with a 6.5/10 bias. The XRP price must break above $1.15–$1.16 to confirm a trend shift. Without that breakout, rallies are likely to face selling pressure near resistance.

No one can predict XRP’s price in 2026 with certainty. Its performance will depend on adoption, regulation, institutional demand, and overall crypto market conditions.
How much will 1 XRP cost in 2030No one knows what XRP will cost in 2030. Its future price will depend on market conditions, utility, adoption, and broader demand for cryptocurrencies.
Can XRP reach $100A $100 XRP price is possible, but it would need much wider adoption, stronger demand, and favorable market conditions. There is no guarantee XRP will reach that level.
Subscribe to our YouTube channel for daily crypto updates, market insights, and expert analysis.
The post XRP Price Has Reached The Most Important Level, Analyst Warns appeared first on CaptainAltcoin.