XRP holds above $1.53 after a bullish close, keeping the recovery structure intact while $1.68 remains the next resistance. MACD momentum has turned positive again, while RSI near 63 shows bu
- XRP holds above $1.53 after a bullish close, keeping the recovery structure intact while $1.68 remains the next resistance.
- MACD momentum has turned positive again, while RSI near 63 shows buyers retain control without reaching previous overbought levels.
- A sustained move above $1.68 could expose $2.00, while losing $1.53 would weaken the current recovery structure.
XRP price action has been recovering from a long period of downward trend, and bulls are coming in to defend $1.53, while momentum indicators are in positive territory and hinting that the price might be on the verge of a breakout to higher resistance levels.
XRP Reclaims Key Support After Extended Decline
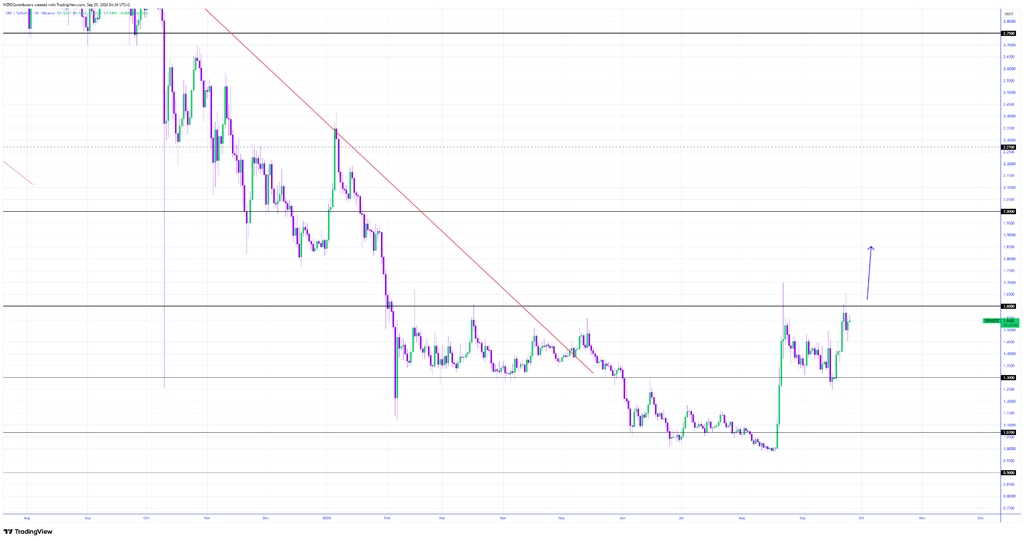
CRYPTOWZRD said XRP closed bullish and identified $1.53 as the key level. The technical outlook places further upside around this reclaimed support area. Holding above that threshold keeps the current recovery structure active.
Source:
X
The broader chart shows a prolonged descending trendline controlling previous rallies. Several rebounds failed before XRP eventually entered an extended consolidation range. That base formed after sellers lost momentum near the lower levels.
A sharp recovery later lifted XRP away from that established trading range. Price subsequently pulled back before buyers returned around higher levels. The sequence has created a series of stronger short-term lows.
The latest chart shows XRP trading around $1.55, according to the supplied market data. The token was up 6.59% over 24 hours during the displayed session. Its market capitalization stood near $97.87 billion, with volume around $4.78 billion.
MACD and RSI Confirm Improving Momentum
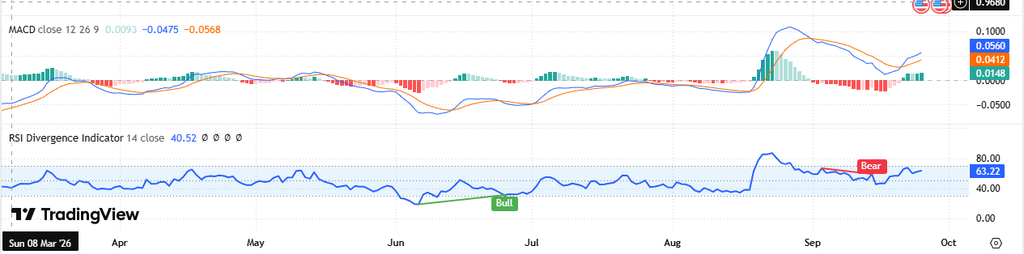
The MACD shows a substantial momentum shift following the August recovery. The blue MACD line moved above the orange signal line during the advance. Positive histogram bars also expanded during the strongest part of that move.
Source:
Tradingview
The MACD as of this writing is at 0.0562 and the signal line is at 0.0413. The gap between both lines remains positive at the latest reading. Recent histogram bars have also returned to positive territory after weakening.

RSI provides additional evidence of stronger momentum across the chart. The indicator previously climbed above 80 during the sharp August advance. It later declined before recovering toward its current reading near 63.35.
A bearish RSI divergence appeared around early September on the displayed chart. That signal preceded a period of weaker momentum and lower RSI readings. However, the indicator has since recovered above the neutral 50 level.
$1.68 Resistance Sets the Next Technical Test
The next major resistance identified in the technical outlook sits around $1.68. This level represents an important test following the recent recovery. A sustained break could shift attention toward the larger $2.00 resistance.
The $2.00 area carries greater weight on the broader chart structure. XRP would need to maintain its recent momentum before reaching that level. The path therefore remains dependent on successive resistance breaks.
The intraday structure also supports the current recovery narrative. XRP initially declined toward roughly $1.47 before buyers regained control. Price then reclaimed $1.50 and advanced through the $1.52–$1.53 region.
Meanwhile, the current setup remains centered on holding reclaimed support. Losing $1.53 could weaken the recovery and return attention toward lower consolidation areas. Conversely, continued strength above support would keep $1.68 within focus.