Monthly RSI dropped below 2020 crash levels as XRP continued trading well below its historical peak. XRP maintained higher cycle lows despite a prolonged correction following its latest multi
- Monthly RSI dropped below 2020 crash levels as XRP continued trading well below its historical peak.
- XRP maintained higher cycle lows despite a prolonged correction following its latest multi-year rally.
- Liquidation activity eased after leveraged positions cleared, while price stabilized above psychological support.
XRP Price remains under close observation after technical indicators reached historically weak levels while market structure continued showing higher long-term support. Traders are now watching whether momentum stabilizes after the recent correction.
Monthly RSI Signals Deep Oversold Conditions
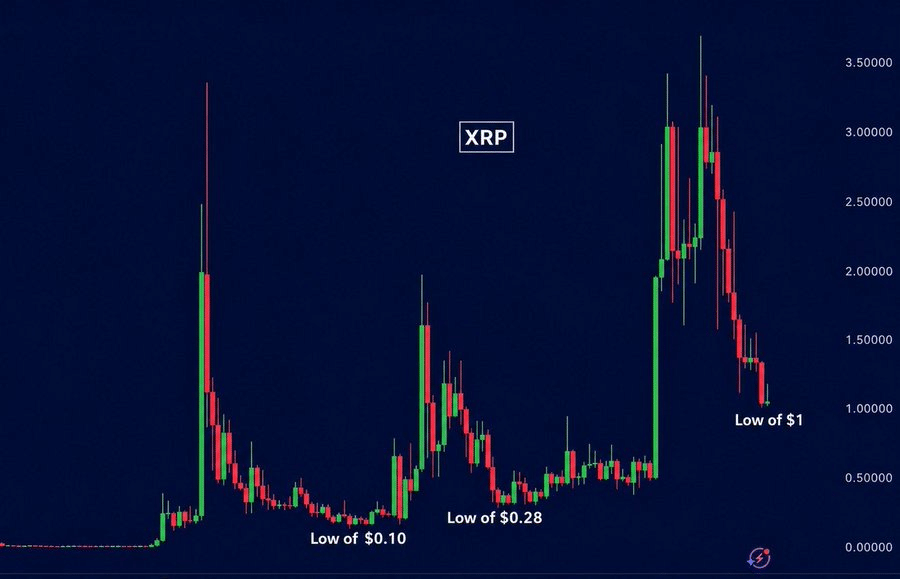
Shahnawaz shared a long-term XRP chart through a post on X. The analyst focused on monthly RSI behavior. The comparison centered on previous market cycles.
Source:
XAccording to the post, XRP trades roughly 72% below its all-time high. Monthly RSI is below 2020 crash readings. That places momentum near historically depressed territory.
The long-term chart also identifies successive market cycles. Earlier corrections bottomed near $0.10 and later around $0.28. The latest correction formed near the $1.00 region.
Each major decline therefore produced a higher long-term floor. That pattern remained visible despite repeated corrections. Structural support gradually shifted higher across market cycles.
Short-Term Trading Shows Stable Support
The latest daily chart reflected changing intraday momentum. Buyers lifted XRP above nearby resistance early. Selling pressure later slowed the advance.
Repeated attempts above $1.09 attracted consistent profit-taking. Price gradually moved into a narrower trading range. Moderate volatility prevailed throughout most of the trading period.
As of this writing, XRP Price was trading at $1.07 with a 0.25% increase in the last 24 hours. Buyers rallied off the lows of late after supporting past the sell-off. Price quickly recovered toward the daily closing area.

Daily trading volume reached approximately $1.02 billion. Activity declined more than 22% from the previous session. Lower participation accompanied relatively stable market conditions.
Liquidation Data Shows Leverage Reset
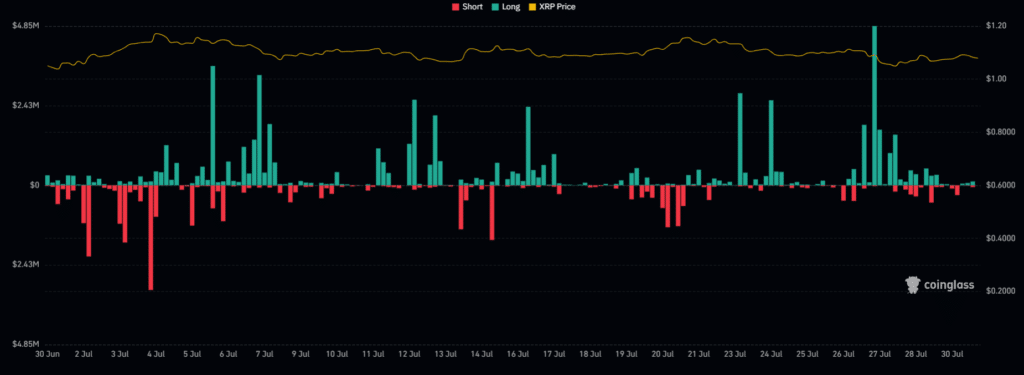
The liquidation chart covered activity between late June and late July. XRP traded mostly between $1.03 and $1.17. Price movements triggered alternating liquidation events.
Source:
CoinglassEarly July produced several notable short liquidations. Some exceeded $3 million during upward price movements. Those forced exits accompanied brief buying surges.
The largest liquidation event occurred near July 27. Long liquidations approached $4.85 million after a modest pullback. Leveraged bullish positions absorbed the largest monthly losses.
Liquidation activity gradually moderated toward month-end. Smaller liquidation bars reflected reduced leveraged exposure. XRP also remained above the psychological $1.00 support throughout the period.
The post XRP Price Holds Key Support as RSI Weakens appears on Crypto Front News. Visit our website to read more interesting articles about cryptocurrency, blockchain technology, and digital assets.