At the time of writing, XRP traded near $1.59, up about 6% over 24 hours, according to CoinMarketCap data. Two levels separate a routine retest from a weaker setup: $1.53 is the immediate lin
At the time of writing, XRP traded near $1.59, up about 6% over 24 hours, according to CoinMarketCap data.
Two levels separate a routine retest from a weaker setup: $1.53 is the immediate line; $1.40-$1.43 is the more consequential support zone below it.
The breakout is facing its first pullback
XRP moved above the upper boundary of the descending channel that contained its late-August and early-September decline, then reached a recent high near $1.70. Coindoo’s earlier analysis of XRP’s break above its downtrend channels set out the key question that follows such a move: can the former ceiling begin to hold as support?
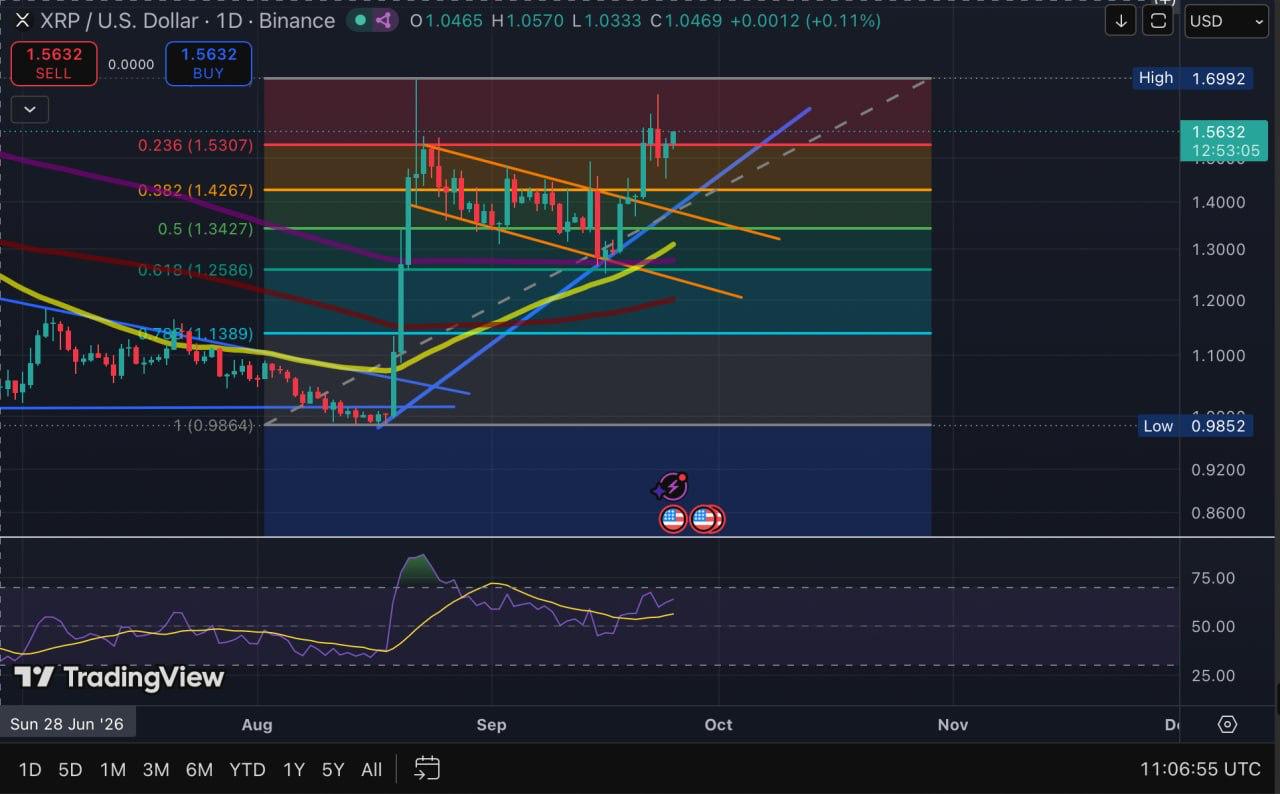
XRP/USD daily chart. The $1.53 Fibonacci level is the immediate retest; Source: TradingView.
The first retest is taking place at the 23.6% Fibonacci retracement near $1.53. A daily close above that level would show that the initial pullback support remains intact. An intraday move below it would carry less weight until the candle closes.
$1.40-$1.43 is the stronger support area
The Fibonacci tool is drawn from the visible daily swing between roughly $1 and $1.70. If XRP closes below $1.53, the focus shifts to the following cluster:
Around $1.40-$1.43: the deeper retest zone
- 38.2% Fibonacci retracement: near $1.43.
- Rising diagonal support: the blue trendline reaches the same area.
- Former channel ceiling: the upper boundary XRP broke above also passes through this range.
These references form a range, not an exact price that must hold to the cent. A brief wick into the area followed by a recovery would leave a different technical picture from successive daily closes beneath it. Persistent trading below the cluster would weaken the case that the earlier channel break is holding.
$1.70 remains the next resistance test
Should XRP continue to close above $1.53, the recent high near $1.70 is the next resistance on the chart. A return there would test whether buyers can extend the move after absorbing the first pullback.
Daily RSI is near 60 after cooling from an earlier spike. That still reflects positive momentum, though the indicator does not determine whether support will hold. The response around $1.53 and, if necessary, $1.40-$1.43 provides the more useful signal.
Whale activity and ETF flows do not settle the chart test
Ali Martinez said on X that his reading of on-chain data showed large holders adding more than 470 million XRP over five days. He also said an inverse head-and-shoulders pattern remained in development on the daily chart.
The reported wallet balances show accumulation, but they do not reveal the buyers’ motives or confirm that the chart pattern will complete.
SoSoValue, reported three consecutive days of net inflows into U.S. spot XRP ETFs through September 24, including $14.89 million on the latest day. The figures show recent demand, while the chart still needs to show whether that interest is sufficient to defend support.
What the next daily close would change
- A close above $1.53: The immediate retest holds and keeps the $1.70 high in view.
- A close below $1.53: XRP moves into a deeper pullback, placing the $1.40-$1.43 cluster under closer scrutiny.
- Continued trading below $1.40-$1.43: The overlapping support references fail, weakening the channel-break structure.
For now, the difference between a routine retracement and a failed breakout depends on how XRP behaves at those two areas. The daily close will provide the clearest evidence.
This article is provided for informational purposes only and does not constitute financial or investment advice. Cryptocurrency markets are volatile, and technical levels can change quickly.
The post XRP Price Keeps Breakout Hopes Alive Despite Recent Pullback appeared first on Coindoo.