XRP price slipped 2.8% over the past seven days and briefly fell below the psychological $1 level as weak daily momentum, persistent capital outflows, and a broader downtrend kept buyers on t
XRP price slipped 2.8% over the past seven days and briefly fell below the psychological $1 level as weak daily momentum, persistent capital outflows, and a broader downtrend kept buyers on the defensive.
Summary
- XRP price declined 2.8% over seven days and traded near $1.00 on Aug. 17.
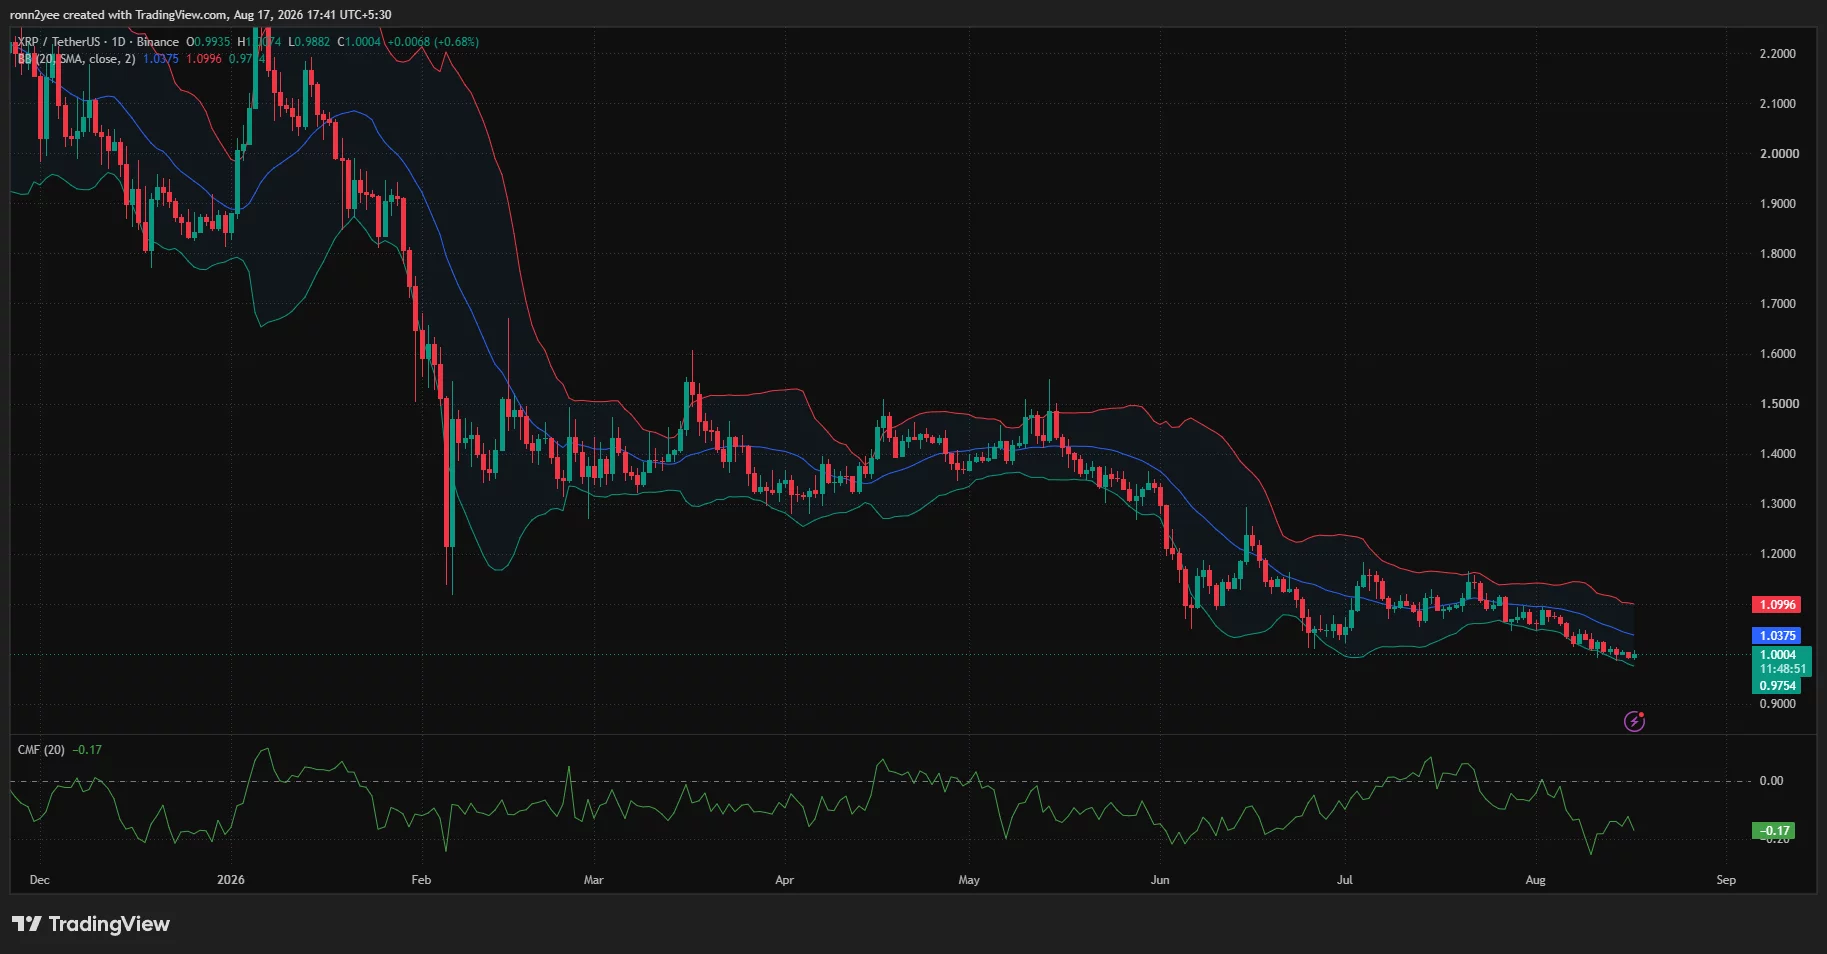
- Daily Bollinger Bands place immediate resistance at $1.037 and support near $0.975.
- Negative daily Chaikin Money Flow shows that sellers still control the broader trend.
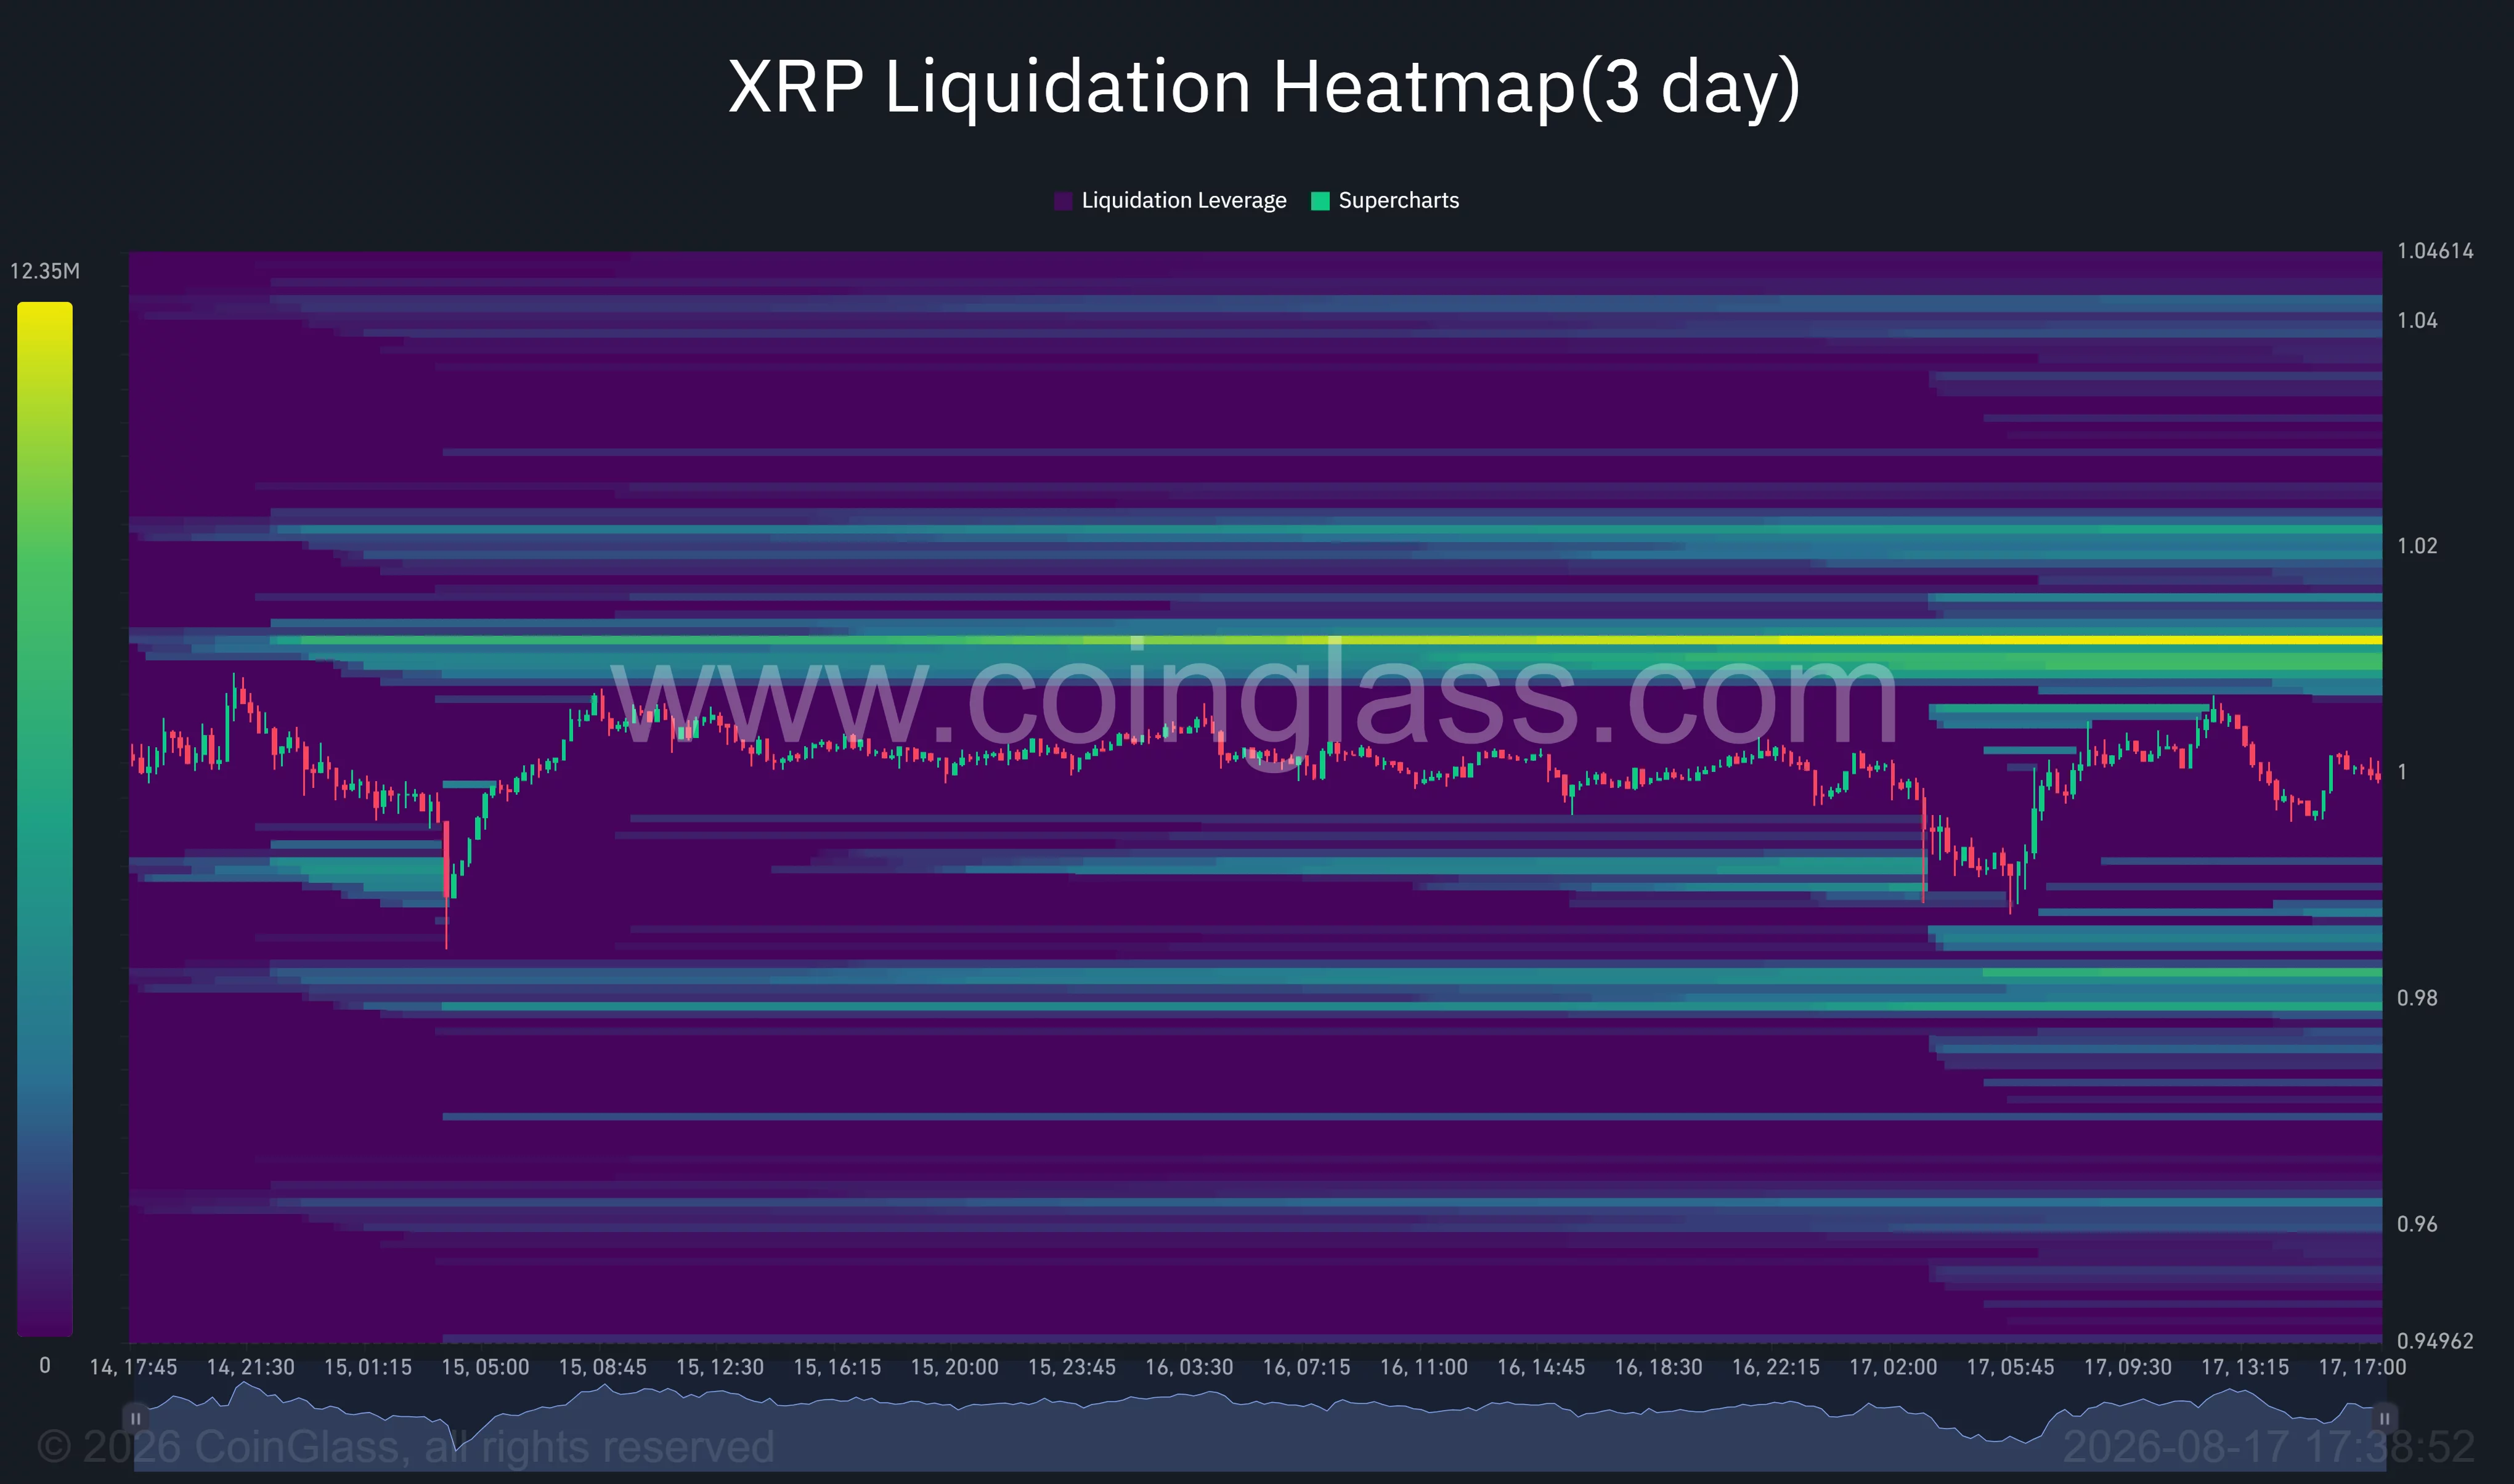
- Liquidation clusters near $1.01 and $0.98 could shape XRP’s next short-term move.
XRP price action today
According to data from crypto.news, XRP (XRP) price was trading around $1.00 on Aug. 17 after briefly falling below the level during the latest sell-off. The token has now lost about 73% from its cycle high above $3, according to market analyst Crypto Patel, while the daily chart continues to produce lower highs and lower lows.
The decline accelerated during the first half of August as XRP fell from approximately $1.14 to a low near $0.98. A short recovery subsequently returned the price to $1.00, but buyers have yet to secure a sustained daily close above nearby resistance.
XRP’s struggle around $1 follows a wider retreat that began after the token traded above $2 in January. It fell sharply to approximately $1.40 in February, consolidated through May, and then resumed its decline in June.
The latest breakdown has placed the token at one of its most important psychological levels. A daily close below $1 would confirm that sellers can keep the price beneath a zone that previously attracted buyers, while a quick recovery could turn the move into a false breakdown.
Lower market participation has added to the pressure. With fewer buyers absorbing sell orders, relatively modest selling can produce wider price swings around the $1 threshold.
You might also like: XRP eyes key week as Ripple CEO speaks in Wyoming
Daily indicators keep XRP under pressure
XRP remains below the middle line of its daily Bollinger Bands, which stands near $1.037. The middle band acts as a short-term trend gauge, meaning the token must reclaim it before the chart can show an early improvement in momentum.
XRP price daily chart — Aug. 17 | Source:
crypto.newsThe upper Bollinger Band sits near $1.099, creating a wider resistance zone between $1.04 and $1.10. XRP has not traded above the upper end of that area since early August, when an attempt to hold around $1.14 failed.
The lower band is positioned at approximately $0.975. Price is currently pressing against this side of the range, showing that the market remains stretched toward the downside. Lower-band contact can precede a temporary bounce, but it does not confirm that the wider decline has ended.
Chaikin Money Flow on the daily chart stands at -0.17. A reading below zero indicates that selling volume has outweighed buying volume during the indicator’s 20-session measurement period.
Persistent negative money flow weakens the case for a durable recovery because rallies are receiving limited support from fresh capital. XRP would need the indicator to move back toward zero, alongside a recovery above $1.037, to provide stronger evidence that accumulation has returned.
4-hour XRP chart shows an early bounce attempt
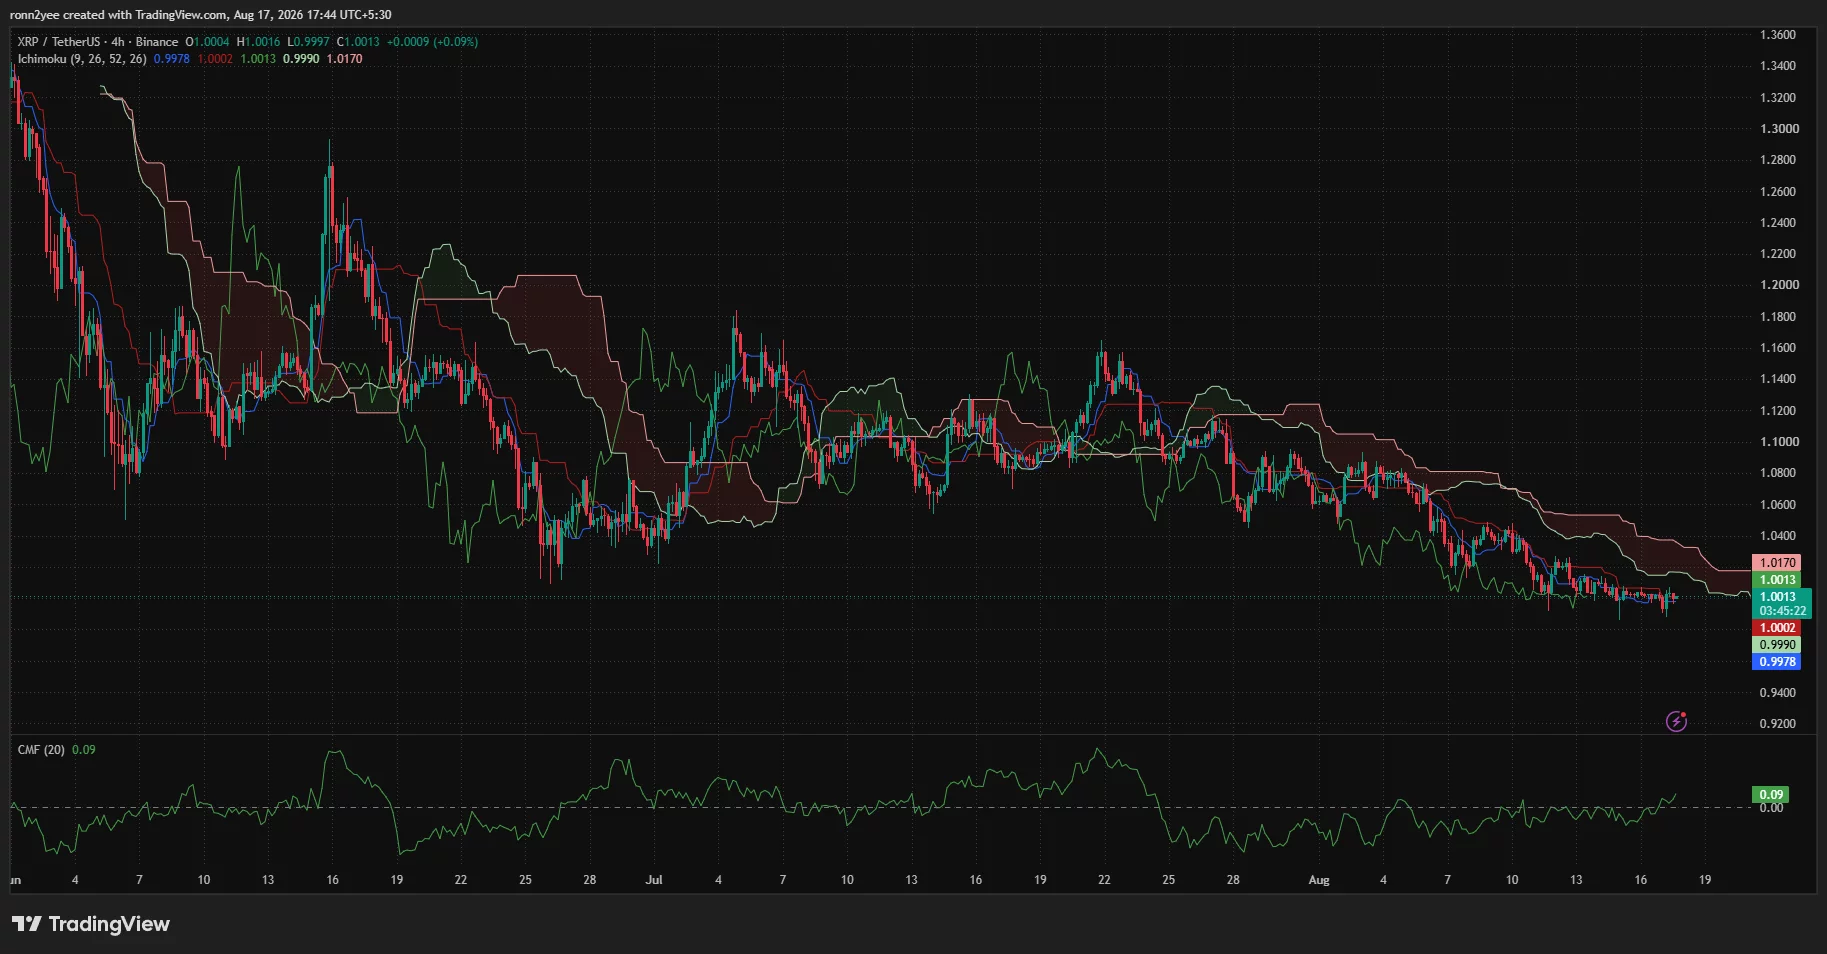
The 4-hour chart offers a slightly more constructive signal. XRP was trading around $1.001 while its Chaikin Money Flow reading had risen to 0.09, suggesting that some buyers entered near the latest lows.
XRP price 4-hour chart — Aug. 17 | Source:
crypto.newsXRP price has also moved marginally above the Ichimoku conversion line near $0.998 and the baseline around $1.000. Those levels show that very short-term momentum has stabilized after the recent decline.
However, XRP remains below the main Ichimoku cloud, with its upper boundary near $1.017. The cloud has also continued to slope downward, maintaining the bearish structure visible since late July.
A 4-hour close above $1.017 would provide the first meaningful sign that buyers are regaining control. The next resistance levels would then sit near $1.037 and $1.05, followed by the daily upper Bollinger Band around $1.10.
Failure to clear the cloud could leave XRP trapped between $0.99 and $1.02. Another rejection near $1.01–$1.02 would increase the risk of renewed pressure on the August low.
Liquidation heatmap places $0.98 at risk
CoinGlass’ three-day liquidation heatmap shows a dense concentration of leveraged positions immediately above XRP’s current price. The strongest nearby upside pool is located around $1.011, with additional liquidity near $1.02.
XRP liquidation heatmap | Source:
CoinGlassPrice often moves toward areas containing large volumes of leveraged positions because liquidations can increase volatility once those levels are reached. A move through $1.011 could therefore trigger short liquidations and help XRP test $1.02.
The downside also contains several liquidity pockets. The clearest cluster sits near $0.98, close to the daily lower Bollinger Band at $0.975. Further concentrations appear around $0.96, although they are less immediate.
A decisive loss of $0.99 could expose the $0.98–$0.975 region and force leveraged long positions to close. If buyers fail to defend that range, XRP could extend its decline toward $0.96.
The heatmap leaves the token between competing liquidity pools, making $1.011 the immediate upside level and $0.98 the main downside target.
Analysts disagree over whether XRP has reached a bottom
Crypto Patel said XRP could fall another 20% to 40% before forming a major reversal. The analyst identified $0.85–$0.65 as a long-term accumulation range but said capital should be deployed gradually rather than used to catch an exact bottom.
Such a decline would require XRP to break the current $0.975 support and extend below the lower liquidity areas shown on the three-day heatmap. The analyst’s longer-term targets of $3, $5, $7, and $10 depend on a future reversal confirmation and are not supported by the current daily trend.
Analyst Gerla offered a more constructive interpretation, arguing that XRP is testing a long-term trendline while forming a bullish divergence on the relative strength index. A bullish divergence occurs when the price records a lower low while momentum produces a higher low, sometimes preceding a recovery.
The competing forecasts make confirmation around $1 more important than either projection. For US investors, the immediate setup remains tied to liquidity and broader risk appetite: reclaiming $1.037 would weaken the bearish case, while a daily close below $0.975 would expose $0.96 and potentially the analyst’s $0.85 accumulation level.
Disclosure: This article does not represent investment advice. The content and materials featured on this page are for educational purposes only.
Read more: Dutch prosecutors sell Knaken’s seized crypto for €2.2M after exchange goes bankrupt