This XRP price prediction starts with the number that matters most: XRP trades around $1.53 as of September 27, 2026, 15:45 UTC. The trend leans bullish after a descending channel breakout th
This XRP price prediction starts with the number that matters most: XRP trades around $1.53 as of September 27, 2026, 15:45 UTC. The trend leans bullish after a descending channel breakout that started in August.
Immediate support sits near $1.26. Immediate resistance sits near $1.99, the psychological zone before $2.
The next real target above that is the $2.44 zone. A daily trading level below $1.26 would put the bullish setup in question.
For a deeper walk through current setups, theprice prediction hub tracks these levels daily. This piece breaks down the short-term outlook, the technical structure, and what it actually takes for XRP to touch $2, $5, or $10.
XRP Price Prediction at a Glance
Numbers below reflect a live snapshot and shift by the hour.
Metric
Data
Current Price
$1.53 (Sep 27, 2026, 15:45 UTC)
24H Change
-0.65%
Market Cap
$96.76 billion
24H Volume
$2.61 billion
Trend
Bullish
Immediate Support
$1.26
Immediate Resistance
$1.99
Next Target
$2.44
RSI (14, daily)
60.59
Invalidation
Daily trading below $1.26
Data pulled from CoinMarketCap and TradingView charting feeds. Broader market context sits in thelatest crypto news coverage updated daily.
Ripple Price Prediction for the Next 7 Days
Short-term traders care about one thing: what breaks first, resistance or support.
Bullish Scenario
A confirmed break above $1.99 on rising spot volume opens the door to $2.44. Target one sits at $2.44, target two at $3.10.
Confirmation needs a full daily trading session above $1.99, not just a wick. Volume has to expand, not fade.
Bearish Scenario
A breakdown below $1.26 flips the short-term picture. First support below that sits at $0.99, then $0.98.
And if $0.98 fails, the bearish thesis gains real weight. That would undo most of the 90-day gain of 47%.
Ripple Technical Analysis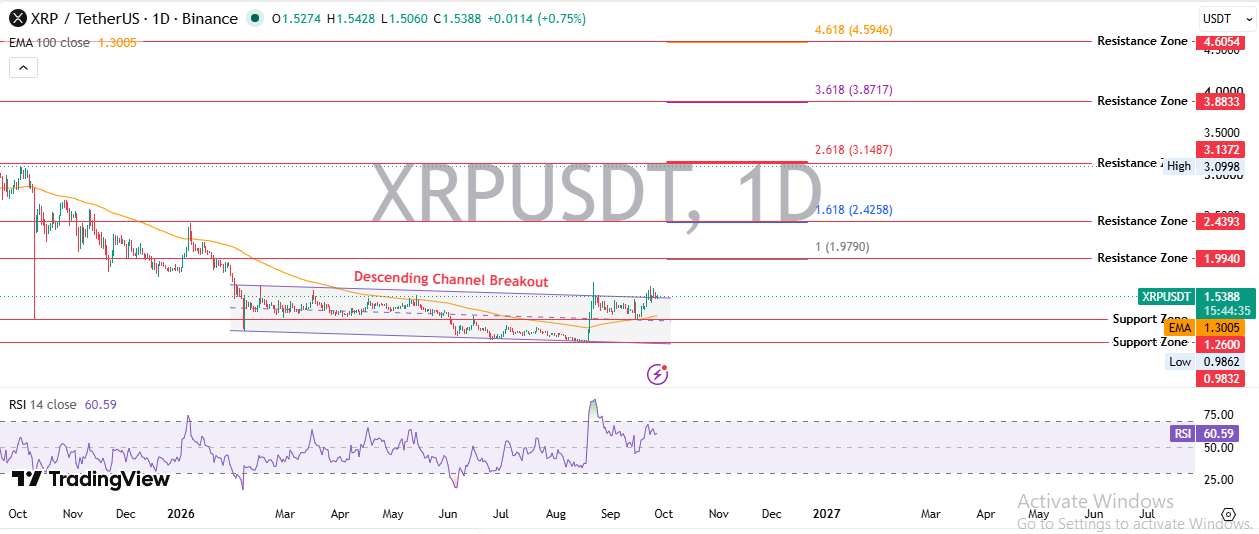
Trend, momentum, and moving averages all point in slightly different directions right now.
Ripple Trend Structure
XRP printed a series of lower lows through most of 2026 before carving a descending channel. The recent breakout above that channel marks the first higher high since the drop began.
The structure isn't confirmed yet. One more higher low would seal it.
$XRP Support Levels
Four zones matter here. $1.26 is the first line, $0.99 the second, $0.98 the third, and the 2026 low near $0.95 the last line before deeper trouble.
$XRP Resistance Levels
Resistance stacks up using Fibonacci extensions. $1.99, $2.44, $3.10 to $3.14, and $3.88 form the ladder above current levels.
RSI Analysis
The 14-day RSI reads 60.59. That's firmly bullish territory without being overbought yet.
No divergence shows up on the daily chart right now. Momentum and price are moving together. That won't last forever.
Moving Average Analysis
Trading sits above the 100-day EMA, currently near $1.30. That's a meaningful cushion.
There's no clean 20/50 EMA cross visible on the current chart, but trading well above the 100 EMA supports the bullish read for now.
Ripple Price Forecast 2026
Three paths exist from here, and each depends on a different set of conditions holding up.
Scenario
Price Range
Key Conditions
Invalidation
Bear
$0.80 - $1.20
Support loss, weak Bitcoin, ETF outflows
Recovery above $1.26
Base
$1.20 - $2.00
Range trading, steady ETF demand
Breakdown below $0.99
Bull
$2.00 - $3.10
Breakout confirmed, volume expansion, BTC strength
Failed breakout back below $1.99
Turns out, the base case is where most of 2026's trading has actually happened.
$XRP Price Prediction 2027-2030
Yearly scenarios below build on supply data and reasonable adoption assumptions, not arbitrary numbers.
$XRP Price Prediction 2027
Base range: $1.80 to $2.80. Bull range: $3.10 to $4.60. Bear range: $0.90 to $1.50.
Major catalyst: expanded XRP ETF adoption. Major risk: regulatory reversal. Implied market cap at the bull range, using current circulating supply, lands near $460 billion.
$XRP Price Prediction 2028
Base range: $2.00 to $3.50.
Bull range: $4.00 to $6.00.
Bear range: $1.00 to $1.80.
Major catalyst: broader tokenization activity on XRP Ledger. Major risk: liquidity contraction across crypto markets. Implied bull-case market cap sits around $600 billion.
$XRP Price Prediction 2029
Base range: $2.50 to $4.00.
Bull range: $5.00 to $7.50.
Bear range: $1.20 to $2.00.
Catalyst: institutional treasury use, the same shift Ripple itself has been flagging. Risk: derivatives-driven volatility wiping out spot gains fast. Implied market cap at the bull range lands near $472 billion.
$XRP Price Prediction 2030
Base range: $3.00 to $5.00.
Bull range: $6.00 to $10.00.
Bear range: $1.50 to $2.50.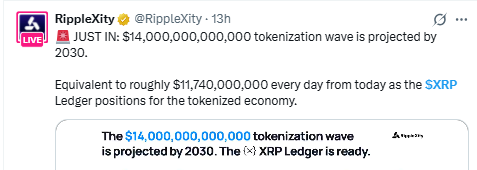
Catalyst: the projectedtokenization wave, estimated near $14 trillion by 2030 according to on-chain analysts. Risk: XRP losing share to competing settlement rails. Implied market cap at the bull range lands near $629 billion.
Can $XRP Reach $2, $5 or $10?
Each target needs a specific market cap, and that number needs context.
Can $XRP Reach $2?
At 62.87 billion circulating supply, $2 implies a market cap near $125.7 billion. That's roughly 30% above the current cap, achievable inside a normal bull leg.
Can $XRP Reach $5?
A $5 trading level implies a market cap of roughly $314 billion. That would place XRP among the largest crypto assets by cap, requiring sustained ETF inflows and a broad market rally. One analyst's$5.40 price target sits just above this range, suggesting the math and the chart reading roughly agree.
Can $XRP Reach $10?
Ten dollars implies a market cap near $629 billion, more than six times today's figure. That level likely needs supply dilution to stay flat and a multi-year adoption cycle behind it. Not impossible. Just not close.
$XRP Market Cap and Supply Analysis
Supply mechanics shape every price target above.
The circulating supply stands at 62.87 billion XRP against a maximum supply of 100 billion. Escrowed XRP gets released from Ripple's ledger on a monthly schedule, which creates steady, and mostly known, dilution pressure.
At full supply release, a $5 trading level would require roughly $500 billion in market cap rather than $314 billion. That gap matters more than most price predictions admit. Recentwallet growth data shows demand from smaller holders picking up alongside the whale activity.
$XRP Catalysts
ETF Flows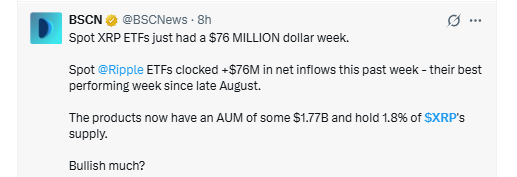
Spot XRP ETFs now hold about $1.77 billion in net assets, with a $22.65 million daily net inflow reported by SoSoValue. Weekly inflows recently hit $76 million, the best stretch since August.
Regulatory Developments
Clearer rules around XRP's legal status continue shaping institutional appetite. Any reversal here would hit sentiment fast.
Ripple / $XRPL Adoption
Ripple has been public about treasury and payroll use cases running on XRPL. That's a shift from pure speculation toward actual utility.
Stablecoin and Tokenization Activity
RLUSD and broader tokenization plans tie directly into XRP Ledger's payment rails. Analysts point to arare 2016 pattern as a bullish precedent worth watching.
Broader Crypto Market Liquidity
Bitcoin's trend still sets the tone for altcoin liquidity. Weak BTC drags XRP down regardless of its own fundamentals.
$XRP Risks
TheXRP investor guide breaks these risk factors down in more depth.
Bitcoin weakness dragging altcoins lower
Liquidity contraction across exchanges
Regulatory uncertainty resurfacing
ETF outflow reversals
A confirmed break of the $1.26 support zone
Escrow-driven supply expansion
A failed breakout back into the old channel
Derivatives-driven volatility from over-leveraged positions
$XRP Bull, Base, and Bear Scenarios
Bull:needs a confirmed breakout, expanding volume, Bitcoin strength, a fresh XRP-specific catalyst, and demand that holds for weeks, not days.
Base: range trading continues, the broader market grows moderately, and no major negative headline hits.
Bear: support breaks, Bitcoin weakens, spot demand fades, and leveraged long positions get flushed out. Given the current long-heavy positioning on Binance and OKX, that flush risk is real.
What Would Invalidate the $XRP Bullish Thesis?
A bullish scenario remains valid only while $XRP holds above the $1.26 structural support.
A confirmed daily trading level below that zone would force every upside target in this piece to be reassessed. That's not a footnote. That's the whole thesis resting on one line.
What Traders Should Watch Next
A confirmed break above $1.99 on rising volume
Spot volume trends across major exchanges
Bitcoin's broader trend direction
$XRP ETF flow data, updated daily
Open interest and funding rates on perpetual futures
When we pulled up the long/short ratio data, the first thing that stood out was how one-sided positioning has become. Binance shows a ratio near 2.49 long-to-short. And that kind of lean often precedes sharp, fast corrections.
Simple framework: a rising price with rising volume confirms strength. Rising price with fading volume warns of exhaustion. Which one is happening right now?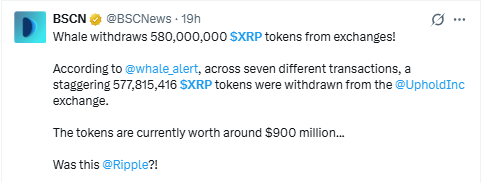
A separate report tracked a580 million XRP withdrawal off a major exchange, worth close to $900 million at current trading levels. Moves that size tend to signal conviction, not panic.
For more on how whale wallets have moved lately, recent coverage onlarge XRP wallet accumulation adds useful context, and background on token mechanics sits in theXRP utility and risk guide.
The setup is bullish, but it's a fragile kind of bullish. One that needs volume to show up and keep showing up.
Disclaimer
This article is for informational purposes only and does not constitute financial advice. Cryptocurrency markets are volatile, and prices can change rapidly. Independent research and consultation with a qualified financial advisor is recommended before making any investment decision. Past performance does not guarantee future results.
