XRP price was hit hard during today’s broader crypto sell-off, dropping about 6% and falling to roughly $1.34 at press time. The move came for largely the same reasons that pushed Bitcoin tow
XRP price was hit hard during today’s broader crypto sell-off, dropping about 6% and falling to roughly $1.34 at press time.
The move came for largely the same reasons that pushed Bitcoin toward $80,000. Rising Treasury yields, renewed expectations for tighter Federal Reserve policy, a stronger U.S. dollar, and heavy liquidations across leveraged crypto positions all pressured risk assets.
That also means yesterday’s bearish XRP scenario played out almost exactly as outlined.
Scenario
Yesterday’s setup
Outcome
Bearish
$1.41 fails and market-wide selling continues
XRP dropped through $1.41 and moved toward the $1.30-$1.33 area
The question now is whether XRP can stabilize after reaching deeply oversold conditions, or whether another leg lower is still coming.
XRP Price Chart Shows Heavy Selling Pressure
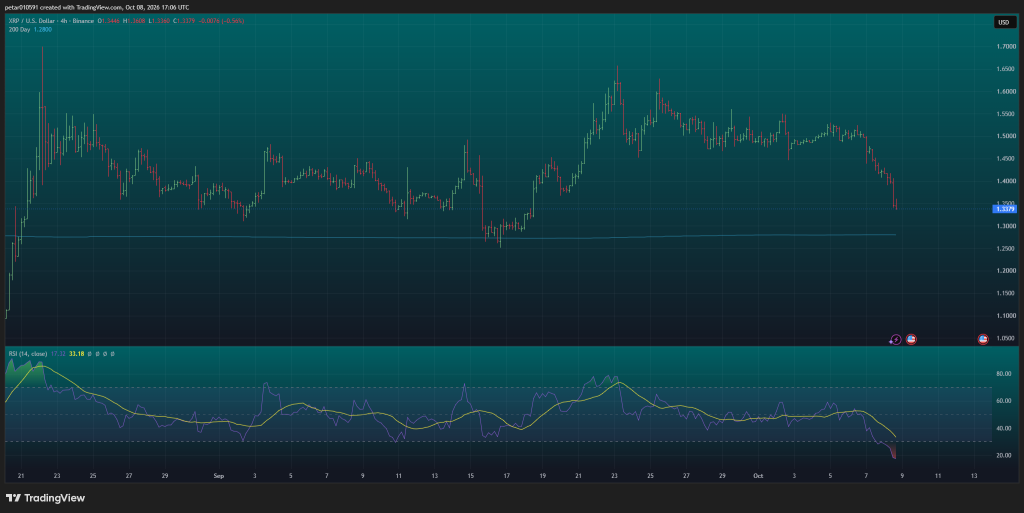
The four-hour chart shows a clear deterioration in structure.
XRP spent much of late September and early October consolidating between roughly $1.48 and $1.53.
That range broke decisively.
Price then lost $1.45, $1.40 and eventually moved toward $1.34 in a fast sequence of red candles.
The first immediate support now sits around $1.33-$1.34.
Below that, the 200-day moving average becomes very important. It sits close to $1.28.
 Source: TradingView
That gives XRP a fairly obvious technical support band between about $1.28 and $1.33.
If that zone fails, the chart becomes considerably weaker.
On the upside, $1.38-$1.40 is now the first resistance area. That zone previously acted as support before today’s decline.
Above that, $1.45 becomes the next important recovery level.
RSI Is Extremely Oversold
The most striking indicator on the chart is RSI.
The four-hour RSI has dropped to roughly 17.
That is far below the traditional oversold threshold of 30.
Its moving average sits around 33, showing just how quickly momentum deteriorated during the latest sell-off.
An RSI near 17 does not guarantee a rebound, but it does tell us that XRP has become heavily stretched to the downside.
That makes a short-term relief bounce increasingly possible.
The problem is that deeply oversold markets can stay oversold when selling pressure is driven by a broader macro event.
So XRP still needs price confirmation.
A bounce that cannot reclaim $1.38-$1.40 would remain weak.
Read also: This Analyst’s XRP Price Forecast Goes From $10 to $3,000+
The 200-Day Moving Average Is Now Critical
The 200-day moving average sits near $1.28 and is probably the most important downside level on the chart.
XRP last approached this area during the September decline before recovering strongly.
A successful defense of $1.28-$1.30 would therefore give bulls a technical reason to expect another rebound.
But losing the 200-day average on a sustained basis would be much more serious.
That could expose the September low around $1.25 and potentially open the path toward the $1.20 region.
XRP Price Prediction for October 9
The setup for October 9 is more balanced than it may look because XRP is now extremely oversold.
The trend is bearish, but a relief bounce can happen quickly after a decline of this size.
Scenario
What could happen
Key XRP price levels
Bullish
Oversold RSI triggers a relief rebound and buyers defend current support
$1.38-$1.40, then $1.44-$1.45
Neutral
XRP stabilizes after the crash and trades sideways near support
$1.31-$1.38
Bearish
Selling continues and the current support zone fails
$1.28-$1.30, then $1.24-$1.25
The bullish scenario depends on XRP holding around $1.33-$1.34 and quickly recovering above $1.38.
If that happens, the next test would be $1.40, followed by $1.44-$1.45.
The neutral scenario would see XRP spend October 9 consolidating between roughly $1.31 and $1.38 as traders digest the latest market-wide sell-off.
The bearish scenario remains very possible if Bitcoin continues falling and macro pressure stays elevated.
A loss of $1.33 would put $1.30 into focus, followed by the 200-day moving average near $1.28.
If $1.28 also fails, the September low around $1.25 becomes the next major level.
For October 9, the $1.28-$1.33 area is the zone that matters most.
XRP is oversold enough for a rebound, but the chart still needs to prove that sellers are losing control.
For more crypto news and price predictions, click here.
Subscribe to our YouTube channel for daily crypto updates, market insights, and expert analysis.
The post XRP Price Prediction for Today (October 9) appeared first on CaptainAltcoin.