XRP price is up around 1.8% today, which could be a positive sign for XRP holders since most of the other big cryptos are either down a bit or not moving much this weekend. Just a slow price
XRP price is up around 1.8% today, which could be a positive sign for XRP holders since most of the other big cryptos are either down a bit or not moving much this weekend. Just a slow price action.
We just published our weekly XRP price prediction article, but in this piece, I want to mention something that crypto veteran MikybullCrypto just posted about XRP. His analysis points to a setup that looks eerily similar to the pattern that preceded the last massive rally.
MikybullCrypto posted a simple but bold message:
“XRP bullish reversal run loading. Before the last run, I screamed for you to buy at a crazy discount. The opportunity is presenting again.”
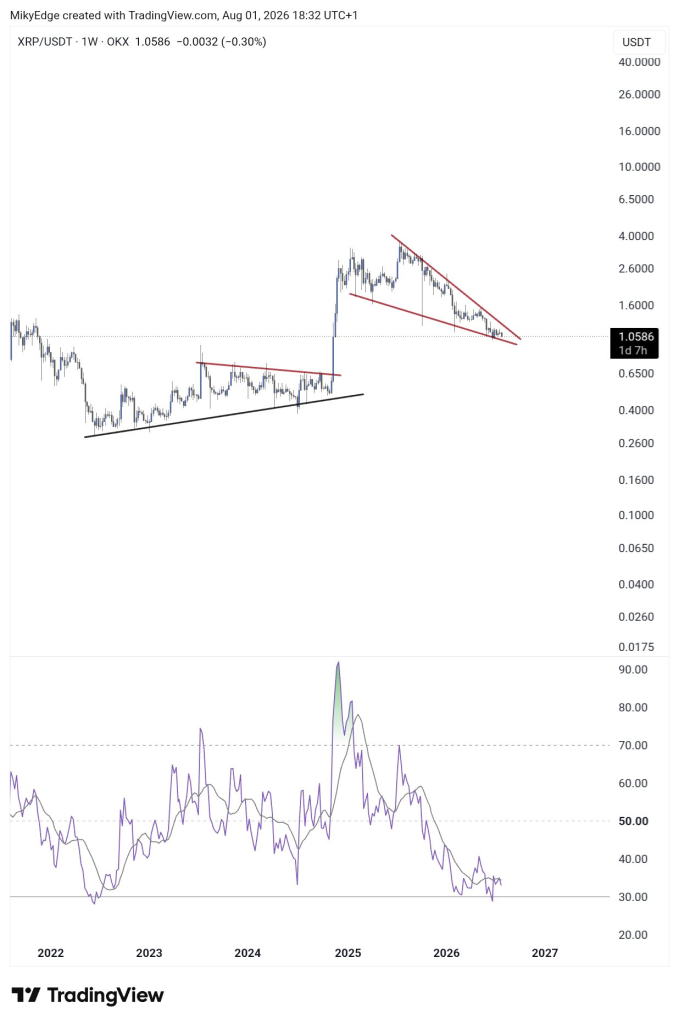
The chart he shared shows why he sees this as a repeat of history. The current descending wedge on XRP’s weekly chart closely resembles the ascending triangle that preceded the 2024 breakout from $0.65 to $2.60+.
The XRP Chart: A Multi-Year Ascending Triangle That Broke
From 2022 to 2024 , the XRP price spent nearly three years consolidating in a classic ascending triangle. Flat resistance sat around $0.65 , while a rising support line of higher lows pushed price into a tightening range. This is a well-known accumulation pattern: sellers defending a fixed ceiling while buyers get progressively more aggressive.
 Source: X/@MikybullCrypto
That pattern resolved with a sharp breakout in late 2024 , where XRP gapped from around $0.65 straight up toward $2.60+ in a single dramatic weekly candle.
Following the breakout, XRP rallied hard, peaking near $3.90 – a roughly 6x move from the triangle breakout point.
The Current XRP Price Setup: A Descending Wedge
Since that peak, the XRP price has been carving out a descending wedge. This pattern features lower highs and lower lows, but with the two trendlines converging rather than running parallel.
Descending wedges are typically considered bullish reversal patterns , especially after a strong prior rally. The logic is that selling pressure is progressively weakening – each new low is a smaller move than the last – even as price grinds lower. This often sets up a sharp reversal once the wedge resolves upward.
The comparison to the earlier triangle is compelling. Structurally, this descending wedge occupies a similar role to the 2022-2024 ascending triangle. Both are multi-year consolidation and basing patterns following a prior move. Both show converging trendlines. Both sit right at a level where a breakout would represent a major structural shift.
That is almost certainly the “same setup” the trader is referring to – not identical shape, but identical function: a long compression phase resolving into a potential breakout.
The RSI pumpede to nearly 90 during the 2024 breakout – an extreme overbought reading consistent with the parabolic move that followed. Since then, it has been in a steady downtrend, recently touching the low-30s (near oversold territory) before ticking up slightly.
This declining RSI throughout the price decline, now showing early signs of curling upward, is a classic momentum divergence to watch. If price makes a similar or higher low while RSI trends higher, that would technically support the reversal thesis.
Price is currently sitting right at $1.0586 , very close to the wedge’s lower boundary and just above the psychological $1.00 level. This is genuinely a decision-point area. A break below the wedge support would invalidate the bullish setup, while a bounce and reclaim of the upper wedge trendline (currently around $1.30–$1.40 given the slope) would be the first confirmation signal.
Read also: $10,000 in XRP Today – Here’s What It Could Be Worth by 2030
Mid-Term XRP Price Prediction
The descending wedge pattern indicates that the XRP price is approaching a critical decision point. If the pattern resolves to the upside, the first target is the upper trendline around $1.30–$1.40. A break above that level would open the door to $1.80–$2.00 , the next major resistance zone from the 2024 rally.
If the bullish scenario plays out fully, XRP could target $3.00–$3.50 in the medium term, which would represent a return to the 2024-2025 highs. That is the “same setup” the analyst is referring to.
However, the pattern is not confirmed until price actually breaks and closes above the upper trendline with conviction. The pattern alone does not guarantee the outcome. XRP could just as easily break the lower support and continue the downtrend instead.
For now, I am watching the $1.00 support and the $1.30–$1.40 resistance. A break above $1.30 would be the first confirmation that the descending wedge is resolving to the upside. A break below $1.00 would invalidate the bullish setup entirely.
Subscribe to our YouTube channel for daily crypto updates, market insights, and expert analysis.
The post XRP Price Shows the Same Setup That Preceded Its Last Massive Rally! appeared first on CaptainAltcoin.