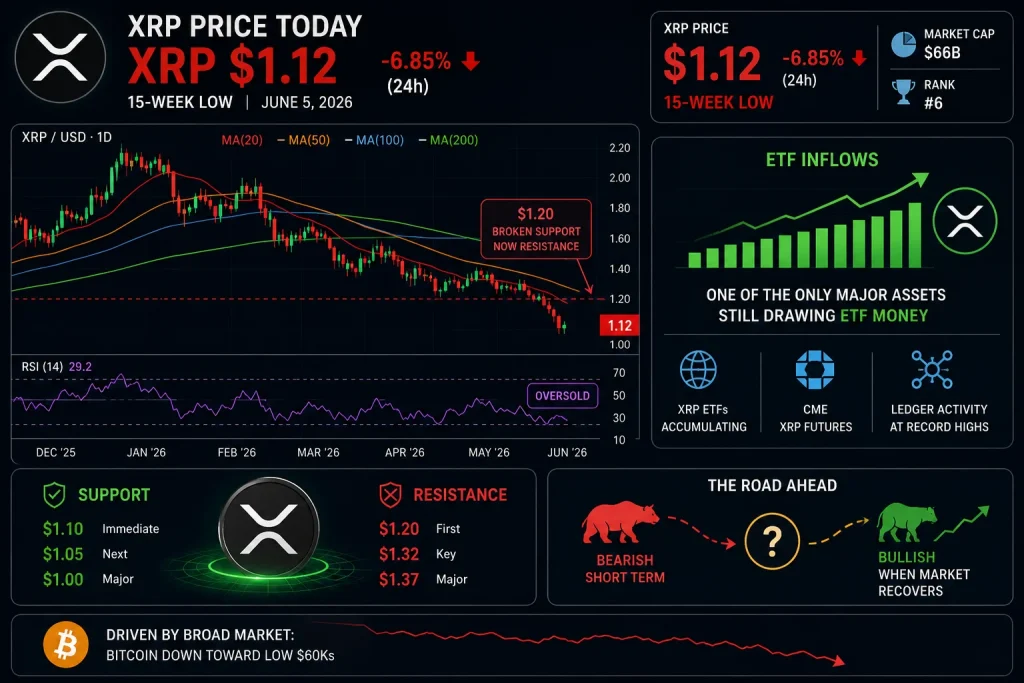
XRP just hit a 15-week low, sliding to $1.12 after losing the $1.20 level buyers had defended. The chart is ugly and deeply oversold. Yet here is the twist: while the price bleeds, XRP is one of the only major assets still pulling in ETF money. That disconnect is the whole story.
XRP is trading near $1.12 on June 5, 2026, down about 6.85% in 24 hours and marking a fresh 15-week low (live XRP price on CoinDesk). The token lost the $1.20 support zone on heavy selling and now sits well below all its major moving averages. Its market cap has slipped to around $66 billion, dropping it to the number 6 spot.
The price action is bearish, but the institutional and on-chain data tell a very different story. Both matter.
What the Daily Chart Shows
The technical setup is firmly bearish, with one stretched indicator.
XRP trades below its 20, 50, 100, and 200-day moving averages, a full bearish stack that confirms sellers are in control. It just broke the $1.20 demand shelf that had held for weeks, turning it into overhead resistance. The 14-day RSI has slipped to around 29, in oversold territory, which means bearish momentum is stretched and a relief bounce is possible, though oversold can persist while the broader market falls.
The near-term range to watch is roughly $1.10 to $1.20. A failure to hold $1.10 opens deeper downside, while reclaiming $1.20 is the first step to stabilizing.
XRP/USD: The Level Map After the Breakdown
The structure shifted lower when $1.20 broke. The levels that matter now:
On the downside, $1.10 is the immediate support XRP is testing, and below it the $1.05 to $1.08 zone is the next floor. On the upside, reclaiming $1.20 is step one, then the $1.32 to $1.37 resistance zone is what XRP must clear to confirm any real recovery. Until then, every bounce is likely to be sold.
What’s Driving XRP Down
The main driver is simple: the broad market crash. Bitcoin has broken toward the low $60,000s on record ETF outflows, and when BTC drops this hard, altcoins like XRP fall with it. XRP has little independent strength to resist that tide right now.
Two XRP-specific factors add weight. Ripple’s monthly escrow unlocks add a steady supply overhang, and on-chain data shows long-term holders who accumulated in the 2022 to 2023 base trimming positions into any strength. Combined with thinning retail flow after the early-2026 rally, there is simply less buying to catch the fall.
The One Number That Matters: ETF Inflows vs a Falling Price
Here is the disconnect worth understanding. Even as XRP makes 15-week lows, it remains one of the only major crypto assets still drawing fresh ETF money (Coinbase market data). The seven US spot XRP ETFs that launched in late 2025 continue accumulating, and Ripple’s institutional infrastructure keeps expanding through CME futures and growing tokenization on the XRP Ledger.
This is the same pattern that has defined XRP all year: the price follows Bitcoin down in the short term, while the long-term institutional foundation strengthens. XRP Ledger activity has been breaking records on transactions and tokenization even as the price fell 27% in the first quarter, a striking gap between usage and price. For holders, the signal that would flip the picture is a return of broad market strength, which would let those institutional flows actually move the price instead of just cushioning the fall.
Key Levels
Support: $1.10 / $1.05 / $1.00 Resistance: $1.20 / $1.32 / $1.37
Bottom Line
XRP fell to $1.12, a 15-week low, after losing the $1.20 support amid the broad crypto crash. The structure is bearish with price below all moving averages, but the RSI is oversold and a relief bounce is possible. The standout is the disconnect: XRP keeps drawing ETF inflows and record Ledger activity even as the price drops.
Reclaiming $1.20 and then the $1.32 to $1.37 zone is what it would take to confirm a turn. Until Bitcoin stabilizes, XRP stays caught between a strong institutional bid and a weak market. Bearish short-term, but better positioned than the price suggests for whenever the market recovers.
FAQ
What is the XRP price today? XRP is trading near $1.12 on June 5, 2026, down about 6.85% in 24 hours and at a fresh 15-week low after losing the $1.20 support level.
Why is XRP falling? XRP is down mainly due to the broad crypto crash, with Bitcoin breaking toward the low $60,000s. XRP-specific pressure from Ripple’s escrow unlocks and long-term holders selling into strength adds to the decline.
Are XRP ETFs still seeing inflows? Yes. Despite the price drop, XRP remains one of the only major crypto assets still drawing fresh ETF money, with the spot XRP ETFs that launched in late 2025 continuing to accumulate.
What are the key XRP support and resistance levels? Immediate support is $1.10, followed by $1.05 and $1.00. On the upside, XRP needs to reclaim $1.20, then clear the $1.32 to $1.37 resistance zone to confirm a recovery.
This is not investment advice. Cryptocurrency is highly volatile. Always do your own research and never invest more than you can afford to lose.