XRP price still hasn’t dipped below $1.00 , but it is trading dangerously close. The token is at $1.01 at press time; just above the psychological level that has acted as support for nearly t
XRP price still hasn’t dipped below $1.00 , but it is trading dangerously close. The token is at $1.01 at press time; just above the psychological level that has acted as support for nearly two months.
One of my favorite analysts, Celal Kucuker, is back with another XRP price analysis that looks really interesting. His take is worth paying attention to.
Kucuker: “No Breakdown Yet – But Watch the Black Line”
Celal Kucuker posted a clear and direct XRP update. His message was measured but carried a warning:
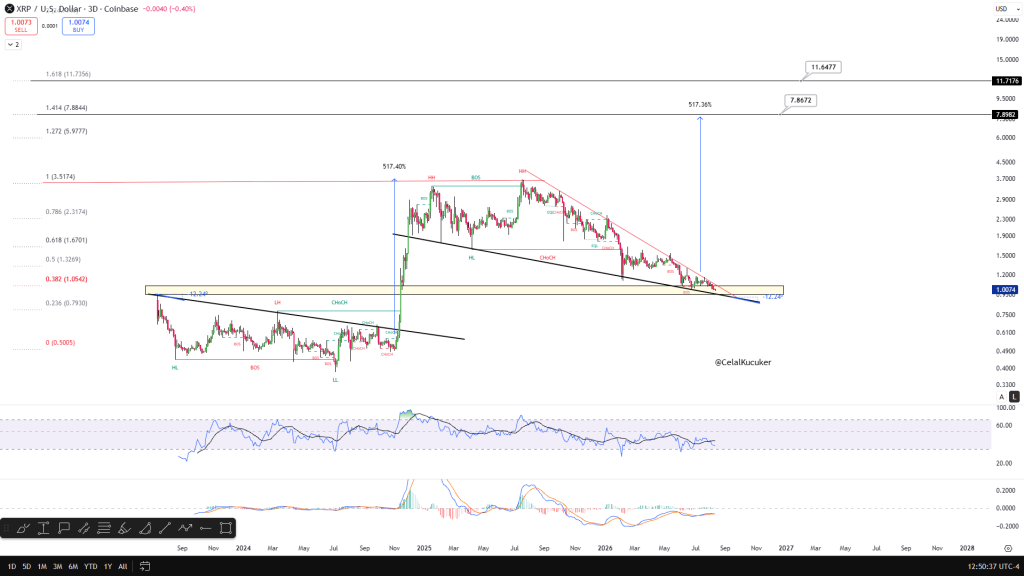
“There’s no breakdown on the XRP chart. It’s still moving within the triangle formation. The yellow zone is a strong support region. Parabolically, it has 7X potential in a bull run.”
Then came the key question: “So, when should you start worrying? If the black line breaks and the weekly close happens below it, then a problematic situation arises. For now, the formation hasn’t broken down.”
The message is simple: the bull case is still alive, but there is a clear line in the sand.
The XRP Chart: A Descending Triangle at the Apex
The 3‑day chart Kucuker shared shows XRP’s price action from mid‑2023 through a projected 2028 target zone. The chart combines Smart Money Concepts (SMC) market structure labeling with Fibonacci extension levels.
After a 2023 decline phase, the XRP price had an explosive breakout in late 2024, rocketing from roughly $0.50 to over $3.50 – a 517.40% move. That was the leg that took XRP from its multi‑year base to its cycle high.
 Source: X/@CelalKucuker
A distribution and topping phase followed in late 2024 and 2025. Price formed a series of higher highs near $3.50–$3.70, but then began carving a descending triangle – visible as the black diagonal trendline connecting lower highs, while horizontal support held around $1.00–$1.20 (the yellow zone).
Current position: the XRP price ($1.01) is right at the apex of that descending triangle, on top of the yellow support zone (~$1.00–$1.20), which lines up closely with the 0.382 Fibonacci retracement at $1.0542 – a technically significant confluence level.
Fibonacci Extension Targets (the bull case):
LevelTarget1.0 (base)$3.5174 (prior high, already tested)1.272$5.97771.414$7.88441.618$11.7356
The chart annotates a 7.8672 → 11.6477 projection (517.36%), essentially mirroring the magnitude of the prior 517% breakout leg – implying that if the triangle resolves upward with similar force, targets in the $7.87–$11.65 range become technically plausible. This is the “7X potential” referenced in Kucuker’s commentary.
RSI is currently around the mid‑50s to 60 range; not overbought, not oversold. It spiked near 100 during the 2024 breakout but has cooled significantly, consistent with the multi‑month consolidation. MACD‑style histogram shows fading momentum bars near the zero line, typical of a compressing and consolidating market rather than strong directional momentum.
Key Technical Read:
- Bullish case: As long as price holds above the black ascending trendline (the lower boundary of the triangle) and the yellow support zone, the multi‑year structure remains intact, and a breakout could realistically target the Fibonacci extension zone ($5.98–$11.65).
- Bearish trigger: A confirmed weekly close below the black trendline would represent a structural breakdown – the point where the “still‑intact” bull thesis would need to be reassessed.
- Right now: Price is coiling at the apex of the triangle – a classic pre‑breakout compression pattern. Volatility (in either direction) is likely to increase from here since triangles cannot compress indefinitely.
Read also: Claude AI Predicts Where XRP’s Bottom Could Be This Cycle
Polymarket Odds Look Strange
This is where things get interesting. The Polymarket odds for XRP dipping below $1 in August were 90%+ yesterday. Today, they are around 51% – with nearly half a million dollars in volume traded on the contract.
That is a massive swing in less than 24 hours. What happened?
The most likely explanation is a combination of profit‑taking and positioning adjustments. Traders who had piled into the “below $1” contract may have taken profits after the odds spiked to extreme levels. The 90%+ reading was pricing in a near‑certainty that XRP would break below $1. That level of conviction is often a contrarian signal – when everyone is convinced something will happen, the market tends to do the opposite, at least in the short term.
The drop to 51% indicates the market is now more balanced. But here is the thing: XRP is at $1.01. A few percentage points dip in August will bring the price below $1. The odds are still elevated relative to where they were in early August (around 50%). The market is still pricing in a big probability of a breakdown.
In any case, I am watching the weekly close. That is the signal that will tell us which way the XRP price is headed.
Subscribe to our YouTube channel for daily crypto updates, market insights, and expert analysis.
The post XRP Price Warning: Here’s Exactly When You Should Start Worrying appeared first on CaptainAltcoin.